An account by Conrad Taylor of the May 2018 meeting of the Network for Information and Knowledge Exchange. Speakers — Hanna Chalmers of Ipsos MORI, Dr Brennan Jacoby of Philosophy at Work, and Conrad Taylor.
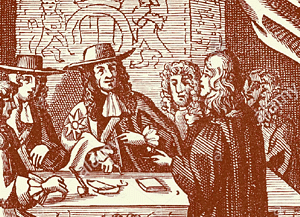
Fake News 1688: the ‘Popish Plot’. Titus Oates ‘revealing’ to King Charles II his totally fabricated tale of a plot to assassinate the monarch: many accused were executed.
(Listen to BBC’s ‘In Our Time’ podcast.)
Background
In the last couple of years there has been much unease about whether the news, information and opinions we find in the media can be trusted. This applies not only to the established print and broadcast media, but also the new digital media – all further echoed and amplified, or undermined, by postings, sharing, comments and trollings on social media platforms.
In the last two years, as news channels were dominated by a divisive US presidential election, and the referendum on whether Britain should leave the EU, various organisations concerned with knowledge and information have been sitting up and paying attention – in Britain, led by the Chartered Institute of Library and Information Professionals (CILIP), and the UK chapter of the International Society for Knowledge Organization (ISKO UK). The Committee of NetIKX also determined to address this issue, and so organised this afternoon seminar.
The postmodern relativism of the 1980s seems back to haunt us; the concept of expertise has been openly rubbished by politicians. Nevertheless, as information and knowledge professionals, we still tend to operate with the assumption that there are objective truths out there. Taking decisions on the basis of true facts is something we value – whether for managing our personal well-being, or contributing to democratic decision-making.
Before this seminar was given its title, the Committee referred to it as being about the problem of ‘fake news’. But as we put it together, it became more nuanced, with two complementary halves. The first half, curated by Aynsley Taylor, focused on measuring people’s trust in various kinds of media, and what this ‘trust’ thing is anyway. The second half, which I curated and included a game-like group discussion exercise, looked at causes and symptoms of misinformation in the media, and how (and with whom) we might check facts.
Ipsos MORI: a global study of trust in media
Our first speaker was Hanna Chalmers of Ipsos MORI, a global firm known to the UK public for political polling, but which has as its core business helping firms to develop viable products, testing customer expectation and experience, and doing research for government and the public sector. Hanna is a media specialist, having previously worked at the BBC, and as Head of Research at Universal Music, before switching to the agency side.
Hanna presented a ‘sneak preview’, pre-publication, of Ipsos MORI research into people’s opinions about the trustability of different forms of media. This 26-country global study had 27,000 survey respondents, and encompassed most developed markets. The company put up its own money for this, to better inform conversations with clients, and to test at scale some hypotheses they had developed internally. Hanna warned us not to regard the results as definitive; Ipsos MORI sees this as the first iteration of an ongoing enquiry, but already providing food for thought.
Issues of trust in media formerly had a low profile for commerce, but is now having an impact on many of Ipsos MORI’s clients. (Even if a company has no political stance of its own, it has good reason not to be seen advertising in or otherwise supporting media sources popularly perceived as ‘toxic brands’.)
The study’s headline findings suggest that the ‘crisis of trust in the media’ that commentators warn about may not be as comprehensive and universal as is thought. However, in the larger and more established economies, a significant proportion of respondents claim that their trust in media has declined over the last five years.
Defining ‘trust’
Trust, said Hanna, is a part of almost every interaction in everyday life. (If you buy a chicken from a supermarket, for example, you trust it has been handled properly along the supply chain.) However, what trust actually means in any given circumstance is highly dependent on context.
The Ipsos MORI team chose this working definition: Trust broadly characterises a feeling of reasonable confidence in our ability to predict behaviour. They identified two elements for further exploration, based on the ideas of Stephen MR Covey, an American author.
1. Is the action committed with a good intention? Does the other party act with our best interests at heart? In the case of a news media outlet, that would imply them acting with integrity, working towards an error-free depiction of events. However, the definition of ‘best interest’ is nowadays contentious. Many people seek news sources that reflect their own point of view, rejecting what is counter to their opinions.
2. Does the other party reliably meet their obligations? In the case of media, defining obligations is not easy. Not all media outlets aim to provide an objective serving of facts; many are undoubtedly partisan. Within new media, much blog content is opinion presented as fact; where sources are cited, they are often unreliable. The news media world is pervaded by a mix of reportage, opinion and advertising, re-written PR and spin, making media more difficult to trust than other spheres of discourse.
Why is trust in media so precarious?
Hanna invited the audience to offer possible answers to this; we responded:
- When we read a story in the news, how do we know if it is true? How can we check?
- The Web has lowered the barrier to spreading narratives and opinions. More content is being presented without going through some editorial ‘gatekeeping’ process.
- There are powerful individuals and interests who want us to distrust the media – fostering public distrust in journalism is advantageous to them.
- It’s a problem that the media uses its own definition of trust.
- Personal ‘confirmation bias’ – where people trust narrators whose opinions, beliefs, values and outlooks they share.
- The trend towards 24-hour news, and other pressures, mean that news gets rushed out without adequate fact-checking, and stripped of context.
And let’s not blame only the media. Hanna cited a 2015 study by Columbia University and the French National Institute, which found that in 59% of instances of link-sharing on social media (e.g. Facebook), the sharer had not clicked through to check out the content of the link. (See Washington Post story in The Independent, 16 June 2016.)
How the survey worked
As already described, the survey engaged in January 2018 with 27,000 people, across 26 countries, and asked about their levels of trust in the media. The sample sets were organised to be nationally representative of age, gender and educational attainment.
The questions asked included:
- To what extent, if at all, do you trust each of the following to be
a reliable source of news and information?
[See below for explanation of what ‘the following’ were.]
- How good would you say each of the following is at providing
news and information that is relevant to you?
- To what extent, if at all, do you think each of the following acts
with good intentions in providing you with news and information?
- How much, if at all, would you say your level of trust in the following
has changed in the past five years?
- How prevalent, if at all, would you say that ‘fake news’ is in
the news and information provided to you by each of the following?
(This was accompanied by a definition of ‘fake news’ as ‘often sensational
information disguised as factual news reporting’.)
‘The following’ were, for each of these questions, five different classes of information source – (a) newspapers as a class, (b) social media as a class, (c) radio television as a class, (d) people we know in real life, and (e) people whom we know only through the Internet.
(In response to questions from the audience, Hanna explained that to break it down to an assessment of trust in particular ‘titles’, e.g. trust in RT vs BBC, or trust in The Guardian vs The Daily Express, would have been too complicated. It would have also made inter-country comparisons impossible.)
In parallel, the team conducted a literature review of other studies of trust in the media.
Hanna’s observations
Perhaps the decline in trust in advanced economies is because the recent proliferation of media channels (satellite TV, social media, news websites, online search and reference sources) means we have a broader swathe of resources for fact-checking, and which expose us to alternative narratives. That doesn’t necessarily mean we trust these alternatives, but awareness of a disparity of narratives may drive greater scepticism.
But driving in the other direction, the rise of social media magnifies the ‘echo chamber’ phenomenon where people cluster around entrenched positions, consider alternative narratives to be untruths, and social polarisation increases.
With the proliferation of media channels, competition for eyes and ears, and a scramble to secure advertising revenue, even long-established media outlets are trying to do more with fewer people – and making mistakes in the process. Social media helps those mistakes and inaccuracies take on lives of their own, before they can be corrected.
‘There is a propensity for consumers to skewer brands that mess up, and remember it’ said Hanna. ‘But it also leads to less than ideal shows of transparency [by brands] after mistakes happen.’ As an example, she mentioned the Equifax credit-rating agency’s data breach of May–July 2017, when personal details of 140+ million people were hacked. It took months for Equifax to come clean about it.
Why is there more trust in the media from people with higher levels of education? Hanna suggested it may be because they are more confident in their ability to discriminate and evaluate between news sources. (Which is paradoxical, in a way, if ‘greater trust in media’ equates to ‘more critical consumption of media’ – something we later explored in discussion.)
Trust, however, remains fairly robust overall, especially in print media, and big broadcast sources such as TV and radio. The category which Ipsos MORI labelled as ‘online websites’ was trusted markedly less. (For them, this label means news and information sites not linked to a traditional publishing model – thus the ‘BBC News’ website would not be counted by Ipsos MORI as an ‘online website’.)
Carrying the study forward
Ipsos MORI wants to carry this work forward, and has set up a global workstream for it. Meanwhile, what might the media themselves take away from this study? Hanna offered these thoughts:
- Media should trust their their audiences, and be transparent about mistakes and clarifications. This does not happen enough – and it applies to advertisers as well. They forget that we are able to check facts, and are more media-savvy and better educated and sceptical than in the past.
- Media needs to be more transparent about its funding models. It was clear, when Mark Zuckerberg was being questioned by American and EU legislators, that many had no idea about how Facebook makes its money.
- Editorial and distribution teams would benefit from greater diversity. That would put more points of view in the newsroom.
In closing, Hanna quoted the American sociologist Ronald S Burt: ‘The question is not whether to trust, but who to trust’. Restoring equilibrium and strengthening trust in the media is important for democracy. She suggested that media owners and communicators need to take responsibility for the accuracy and trustability of their communications.
Questions and comments for Hanna
One audience member wondered if differing levels of trust had shown up across the gender divide. Hanna replied, across the world women display a little more trust – but it’s a smaller differential than that linked to educational attainment.
Several people expressed surprise at greater educational attainment correlating with greater trust in media – surely those better educated are more likely to be cynical (or more kindly, ‘critical’)? Claire Parry pointed out that more educated people are also statistically more likely to work in the media (or know someone who does).
But someone else suggested that the paradox is resolved if we consider that more educated people may tend more firmly to discriminate between particular publications, broadcasters and online news sources, and follow ones they trust while ignoring others. If such a person is asked, ‘how much do you trust newspapers’ and they interpret that question as ‘how much do you trust the newspapers that you yourself read’, they are more likely to answer positively. How questions are understood and reacted to by different people is, of course, a major vulnerability of survey methodologies.
This leads on to an issue which David Penfold raised, and which has been on my mind too. Is there validity in asking people how much they trust a whole category of media, when there are such huge discrepancies in quality of trustworthiness within each category?
I would certainly not be able to answer this survey. If you ask me about trusting print media, I would come back with ‘Do you mean like The Guardian or like The Daily Express or The Daily Mail? Do you mean like Scientific American or The National Enquirer?’ To lump them together and ask me to judge the trustability of a whole category feels absurd to me. Likewise, there are online information sources which I find very trustworthy, while others are execrable. Even on Facebook, I have ‘online-only friends’ who reliably point me towards science-backed information, and I have grown to trust them, while others are entertaining but purvey a lot of nonsense.
Hanna remarked that the whole project is crying out for qualitative research, to which Ainsley added ‘If someone will pay for it!’ Traditional forms of qualitative research (interviews, focus groups) are indeed expensive, but perhaps the micronarrative-plus-signifiers approach embodied in SenseMaker methodology could be tackle these questions. This can scale to find patterns in vast arrays of input, cost-effectively, and can be deployed to track ongoing trends over time. (We got a taste of how that works from Tony Quinlan at the March 2018 NetIKX meeting).
A further caveat was put forward by by David Penfold: just because a source of news and opinion is trusted, it doesn’t mean it’s right. A lot of people trusted The Daily Mail in the 1930s, when it was preaching support for Hitler and promoting anti-semitic views.
Dave Clarke thought that the survey insights were valuable; it was good to see so much quantitative data. He offered to connect the Ipsos MORI team with people he has been working with in the ‘Post-Truth’ area (of which we would hear more later that afternoon).
Martin Fowkes wondered about comparisons between very different countries and media environments. In the UK we can sample a wide spectrum of political news, but in some countries the public is fed a line supporting the leadership’s political agenda. In such conditions, if you ask these poll questions, people may ‘game and gift’ their responses, playing safe. Hanna acknowledged that problem, and suggested that each separate country could be a study in itself.
Aynsley and Hanna agreed with Dion Lindsay that this project was in the nature of a loss-leader, which might help their market to show more interest in funding further research. Also, it is important to Ipsos MORI to be able to demonstrate thought leadership to its client base through such work.
Brennan Jacoby on the philosophical basis of trust
Aynsley then introduced Dr Brennan Jacoby, whom he first saw speaking about trust at the Henley Business Centre. A philosopher by trade, Brennan would unpick what trust actually might mean.
Brennan explained that his own investigations into the concept of trust started while he was doing his doctoral work on betrayal (resulting in ‘Trust and Betrayal: a conceptual analysis’, Macquarie University 2011. Much discussion in the literature about trust contrasts trust with betrayal, but fails to define the ‘trust’ concept in the first place. In 2008, Brennan started his consulting practice ‘Philosophy at Work’. Trust was the initial focus, and remains a strong element of his work with organisations.
Brennan asked each of us to think of a brand we consider trustworthy – it could be a media brand, but not necessarily. We came up with quite a variety! – cBeebies, NHS, Nikon, John Lewis…
He told us that one time when he tried this exercise, someone shouted ‘RyanAir!’ She then explained that all RyanAir promise to do is to get you from A to B as cheaply as possible – and that they do. It seems a telling example, illustrating a breadth of interpretations around what it means to be trustworthy (is it just predictability, or is it something more?)
Critiquing the Trust Barometer
Edelman is an American public relations firm. Over the last 18 years it has published an annual ‘Trust Barometer’ report (see the current one at https://www.edelman.com/trust-barometer), which claims to measure trust around the world in government, NGOs, business, media and leaders.
(Conrad notes: there is some irony, in that Edelman has in the past acted to deflect antitrust action against Microsoft, created a fake front group of ‘citizens’ to improve WalMart’s reputation, and worked to deflect public disapproval of News Corporation’s phone hacking, oil company pollution and the Keystone XL pipeline project, amongst others.)
In the Trust Barometer 2018 report, they chose to separate ‘journalism’ from ‘media outlets’ for the first time, reflecting a growing perception that those information sources which are social platforms, such as Facebook, have been ‘hijacked’ by different causes and viewpoints and have become untrustworthy, while professional journalists may still be considered worthy of trust.
It’s interesting to see how Edelman actually asked their polling question. It went: ‘When looking for general news and information, how much would you trust each type of source for general news and information?’, followed by a list of sources, and a nine-point scale against each. Again, this survey fails to define what trust is. If we think about to the Covey definition cited by Hanna, a respondent might say, ‘Yes I trust journalists [because I think they are competent to deliver the facts]’; another respondent might say, ‘yes, I trust journalists [because I think they have good intentions].’ Someone might also say, ‘Well, I have to trust journalists, because in my country I have no choice.’
A philosophy of trust
The role of philosophy in society, said Brennan, should be to solve problems and be practical. Conceptual work isn’t merely of academic interest, but can make key distinctions which can suggest ways forward. So let’s consider the concepts of trust, trustworthiness, and finally distrust.
The word Trust can connote a spread of meanings. There’s trust in individuals, whom we meet face to face, but also those we will never meet; we may consider trust in organisations, in machinery and artefacts, or in artificial intelligence. This diversity of application may be why many conversations around trust shy away from more specificity. But a lack of specificity leaves us unable to distinguish trust from other things.
Trust may be distinguished from mere reliance. The philosophical literature agrees by and large that trust is a kind of reliance, but not just ‘mere reliance’. As an American, Brennan has no choice but to rely on Donald Trump as President – you might say count on him – given that he (Brennan) doesn’t have access to the same information and power. But Brennan doesn’t trust him. Or suppose at work you need to delegate a responsibility to someone new to the role. You have to rely on the person, but you are not quite sure you can trust them.
Special vulnerability. What distinguishes trust from mere reliance is a special kind of vulnerability. To set the scene for a thought experiment, Brennan told a story about the German philosopher Immanuel Kant (1724–1804). He was known for being obsessive about detail. The story goes that as he took his regular walk around town, the townsfolk would set the time on their clocks by the regularity of his appearance. Imagine that one day Kant sleeps in, and that day the townsfolk don’t know what time it is. They might feel annoyed, but would they feel betrayed by him? Probably not.
But now, suppose there is a town hall meeting where the citizens discuss how to be sure of the time, and Kant says, ‘Well, I take a walk at the same time each day, so you can set your clocks by me!’ But suppose one day he sleeps in or decides not to go for his walk. Now the citizens might feel let down, even betrayed. Because of Kant’s offer at the town meeting, they are not just ‘counting on’ him, they are ‘trusting’ him. They thought they had an understanding with him, which set up their expectations in a way they didn’t have before. They may say, ‘We don’t just expect that Kant will walk by at a regular time – we think he ought to.’ There is a distinction here between a predictive expectation, and what we could call a normative one.
Trust = optimistic acceptance of special vulnerability
So, Brennan suggests, we should think about trust as an acceptance of vulnerability; or more precisely, an optimistic acceptance of a special vulnerability. An ordinary kind of vulnerability might be like being vulnerable to being knocked down while crossing the road, or being caught in a rain-shower. This special vulnerability, which is the indicator of trust, is vulnerability to being betrayed by someone in a way that does us harm. There is a moral aspect to this kind of vulnerability, tied up in agreements and expectations.
Regarding the ‘optimism’ factor – suppose you need to access news from a single source, because you live in a country where the media is controlled by the State. That makes you vulnerable to whether or not you are being told the truth. You may say, ‘Well, it’s my nation’s TV station, I have to count on them.’ But suppose you have travelled to other countries and seen how differently things are arranged abroad, you may not be very optimistic about that reliance.
To sum up: Trust is when we optimistically accept our vulnerability in relying on someone.
Trust is not always a good thing!
Brennan showed a picture of a gang of criminals in New South Wales who had holed up in a house together and stayed hidden from the police, until one went to the police and betrayed the others. Did he do good or bad? Consider whistleblowing, where it can be morally positive, or there is good reason, to be distrustful or ‘treacherous’. Trust, after all, can enable abuses of power. Perhaps we should not be getting too flustered about an alleged ‘crisis of trust’ – perhaps it would not be a bad thing if trust ebbs away somewhat – because to be wary of trusting may be rational and positive.
Brennan notes, people may be thinking ‘Hey, if we are not going to trust anyone or anything, we’re not going to make it out the front door!’ But that’s only true if we think reliance and trust are exactly the same. Separating those concepts allows to get on with our lives, while retaining a healthy level of wariness and scepticism.
Baroness Onora O’Neill speaking about trust and distrust
at a TEDx event at the Houses of Parliament in June 2013.
Brennan recommended reading or listening to Baroness Onora O’Neill, an Emeritus Professor of the University of Cambridge who has written and spoken extensively on political philosophy and ethics, using a constructivist interpretation of the ethics of Kant. O’Neill places great emphasis on the importance of trust, consent, and respect for autonomy in a just society. Brennan told us that she gave a TED talk some years ago (2013), in which she argued that we should aim for appropriately placed trust (and appropriately placed distrust).
See talk video at ted.com…
Trustworthiness
When trust is appropriately placed, usually it is because it is placed in someone who is (or at least, is perceived to be) ‘trustworthy’. So what does that mean?Three things are important for trustworthiness, said Brennan; they relate quite well to Stephen MR Covey’s two points.
Competence — As the Australian moral philosopher Dr Karen Jones puts it, ‘the incompetent deserve our trust almost as little as the malicious.’ But in the sphere of media, a further distinction is useful – between technical competence and practical competence. Technical competence is the ability to do the thing that someone is counting on us for – so, will Facebook not give our details to a third party? If we expect them to prevent that, and they know that, are they competent to do so? Practical competence is, further, the ability to track the remit, to be on the same page as what one is being counted on to do.
Suppose you are away travelling, and you ask someone to look after your house while you are away. You may feel confident that they are technically competent to check on security, feed the cat, etc. You probably don’t think you need to leave a note saying ‘Please don’t paint the bathroom.’ You take it for granted that they know what it means to be a house-sitter. If you come back and find the whole place redecorated, even if you love the result, you’re not going to ask them to house-sit again.
This analogy and analysis is important in Facebook’s situation, because there has been a disconnect about what the parties are expecting. It would seem Facebook saw their relationship with us to be different from what we would have assumed. Perhaps the solution is to have a more explicit conversation about expectations.
Dion asked if these conditions of competence are not more to do with reliability than trust, and Brennan agreed. They are the preconditions for trustworthiness, but they are not sufficient.
Integrity of character — this is where the full definition of trustworthiness comes in. Reliability is all one may hope for from an animal, or a machine. Trust further involves the acceptance of a moral responsibility and commitment. Linking back to previous discussion, Brennan said that trust is a relationship that can be had only between members of ‘the moral community’. Reliability is what we expect from an autonomous vehicle; trust is what we might extend to its programmers. And programmers may be deemed to be trustworthy (or not), because they can have Character.
So if we have a media source competent at its job, and committed to doing it, we can so far only rely on them to do what we think they will always do. That is not enough to elicit trust. Assessing trustworthiness involves assessment of moral values, and integrity of character.
How do we assess ‘good character’? Many people are likely to ascribe that value to people like themselves, with whom they share an understanding of the right thing to do. We expect others to do certain things, but adding the factor of obligation clarifies things. For example, we might predict that hospitals will keep missing care targets; but additionally we expect that hospitals ought to care and not kill: this is the constitutive expectation which governs the relationship between users and services.
Brennan noted something unusual (and valuable) about how Mark Zuckerberg apologised after the recent Cambridge Analytica scandal. When most companies screw up, they apologise in a manner that responds to predictive expectations (‘we promise not to miss-sell loans again’, ‘we will never again use flammable cladding on residential buildings’). Zuckerberg’s apology said – ‘Look, sorry, we were wrong – we did the wrong thing.’ That’s valuable in building trust (if you believe him, of course): he was addressing the normative expectations. The anger that feeds the growth of distrust is driven by a sense of moral hurt – what I thought ought to have happened, didn’t.
Distrust
In his final segment, Brennan analysed the concept of distrust as involving scepticism, checking up, and ‘hard feelings’.
Showing images of President Trump and Matt Hancock (UK Secretary of State for Digital, Culture, Media and Sport) Brennan remarked: you may be sceptical about what Trump says he will do or did do; you might check up on evidence of promises and actions; you may have feelings of resentment too. As for Hancock (who also has various demerits to his reputation) – well, said Brennan, he doesn’t trust either of these men, but that doesn’t mean he distrusts both of them. He actively distrusts Trump because of his experience of the man; until recently he didn’t even know Hancock existed, so the animosity isn’t there. There’s an absence of trust, but also an absence of distrust: it’s not binary, there’s a space in the middle.
That could be significant when we talk about trusting the media, and building trust in this space. If we are going to survey or study the degree to which people trust the media, we must be careful to ensure that the questions we put to people correctly distinguish between distrust and an absence of trust; and perhaps distinguish also between mere reliance and true trust.
Perhaps in moving things forward, it may be too ambitious, or even misguided, to aim for an increase in trust? Perhaps the thing to aim for in our media and information sources is Reliability, because that is something we can check up on (e.g. fact-checking), regardless of subjective feelings of trust, distrust, or an absence of trust.
Q&A for Brennan
Bill Thompson (BBC) noted that a Microsoft researcher, danah boyd, who examined the social lives of networked teens, talks about the ‘promise’ that is made: that is, a social media network offers you a particular experience with them, and if you feel that promise has been betrayed, distrust arises. Matt Hancock had not offered Brennan anything yet… The question then is, what is the promise we would like the media to make to us, on which we could base a relationship of trust?
Brennan agreed. Do we know what expectations we have of the media? Have we tried to communicate that expectation? Have the media tried to find out? Bill replied, media owners and bosses can get very defensive very quickly, and journalists will complain that people don’t understand how tough their jobs are. But that’s no way to have a conversation!
Naomi Lees wondered about trust in the context of the inquiry into the June 2017 fire disaster at Grenfell Tower (the inquiry was about to start on a date shortly after this meeting). There is much expectation that important truths will and should be revealed. She thought that was an advance compared to the inquiry into the Hillsborough disaster, where there was a great deal of misinformation and police cover-up, and it took years for the truth to come out.
Conrad Taylor on ‘A Matter of Fact’
After a brief refreshment break, the seminar entered its second part, with a focus not so much on trust and trustworthiness, more on the integrity and truthfulness of news and factual information – both in the so-called ‘grown up media’ of print journalism and broadcasting, and the newer phenomena of web sites and social media platforms.
To open up this half of the topic, I had put together a set of slides, which has been converted to an enhanced PDF with extended page comments. It also has an appendix of 13 pages, with 80 annotated live links to relevant organisations, articles and other resources online.
I was eager to leave 50 minutes for the table-groups exercise I had devised, so my own spoken presentation had to be rushed in fifteen minutes. Because a reader can pretty much make sense of much of my presentation by downloading the prepared PDF and reading the page comments, I shall just summarise my talk briefly below.
A matter of fact, or a matter of opinion?
I started with a display of claims that have been seen in the media, particularly online. Some (‘Our rulers are shape-shifting reptilians from another planet’) are pretty wild; ‘MMR vaccine has links to autism’ has been comprehensively disproved in the medical literature; but others such as ‘Nuclear energy can never be made safe’ have been made in good faith, and are valid topics for debate.
Following events such as Russia’s annexation of Crimea, the 2016 US Presidential election, the 2017 Brexit referendum, and the war in Syria, more people and organisations have been expressing alarm at the descent into partisanship, propaganda and preposterous claims in both the established and new media. In the UK, this has included knowledge and information management organisations.
CILIP, the Chartered Institute for Library and Information Professionals, took the lead with its ‘Facts Matter’ campaign for information literacy. ISKO UK, at its September 2017 conference, hosted a panel called ‘False Narratives: developing a KO community response to post truth issues.’ (Full audio available; see links in PDF.) Dave Clarke of Synaptica ran a two-day seminar at St George’s House in January 2018 examining ‘Democracy in a Post-Truth Information Age’, and its report is also available; most recently, ISKO UK returned to the topic within a seminar on ‘Knowledge Organization and Ethics’ (again, audio available).
Dodgy news stories are not new. Rather akin to modern partisan disinformation campaigns was Titus Oates’ 1678 claim to have discovered a ‘Popish Plot’ to assassinate King Charles II (a complete fabrication, but it led to the judicial murder of a couple of dozen people).
Beyond ‘fake news’ to a better-analysed taxonomy
Cassie Staines recently argued on the blog of the fact-checking charity Full Fact that we should stop using the label ‘fake news’. She says: ‘The term is too vague to be useful, and has been weaponised by politicians.’ (Chiefly by Donald Trump, who uses it as a label to mobilise his supporters against quality newspapers and broadcasters who say things he doesn’t like). The First Draft resource site for journalists suggests a more nuanced taxonomy spanning satire and parody, misleading use of factual information by omitting or manipulating context, impersonation of genuine news sources, and completely fabricated, malicious content.
The term ‘post-truth’ got added to the Oxford English Dictionary in 2016, defined as ‘relating to or denoting circumstances in which objective facts are less influential in shaping public opinion than appeals to emotion and personal belief.’ If we want a snappy label, perhaps this one is better than ‘fake news’, and Dave Clarke appropriated it for his project the Post Truth Forum (PTF), to which I am also a recruit. PTF has attempted a more detailed two-level typology.
I briefly mentioned conspiracy theories and rumours such as ‘the 9/11 attacks were an inside job’. A 2014 article in the American Journal of Political Science, ‘Conspiracy Theories and the Paranoid Style(s) of Mass Opinion’ rejects the idea that these are unique to ignorant right-wingers, and says that there is more of a link to a ‘willingness to believe in other unseen, intentional forces and an attraction to Manichean narratives.’ (A certain tendency to conspiracy theory can also be found amongst elements on the environmentalist, left-libertarian and anarchist communities – which is not to say that everyone in those communities is a ‘conspiracist’.)
Misleading health information (anti-vaccination rumours, touting ‘alternative’ nutrition-based cancer treatments) is a category that has been characterised as a public health risk. In the case of the rubbish touted by Mike Adams’ site ‘Natural News’, there is a clearly monetised motive to sell dietary supplements.
Transparency and fact checking
Validating news in a ‘post-truth’ world brings up the question of transparency of information sources. It’s hard to check stories in the media against facts, when the facts are being covered up! Governments are past masters at the cover-up, and it is a constant political struggle to bring public service truths and data, policies and true intentions out into the open. Even then, they are subject to being deliberately misrepresented, distorted, spun and very selectively presented by politicians and partisan media. Companies have done the same, examples being Volkswagen, Carillion, Syngenta; and public relations organisations stand ready to take money to help these dodgy activities.

Karen Schriver speaks about the quest for Plain Language and transparency in American public life & business.
(Listen to podcast.)
But even when information is available, it is often not truly accessible to the public – because it may be badly organised, badly worded, badly presented – not through malice, but because of misunderstanding, incompetence and lack of communication skills. This is where information designers, plain language specialists, technical illustrators and data-diagrammers have skills to contribute. I suggest listening to a podcast of an interview with my friend Dr Karen Schriver, who was formerly Professor of Rhetoric and Document Design at Carnegie-Mellon University: she speaks about the Plain Language movement in the USA, and its prospects (again, link in PDF).
When it comes to reality checking, sometimes common sense is a good place to start. I took apart an article in London’s Evening Standard quoting a World-Wide Fund for Nature estimate that the UK uses 42 billion plastic straws annually. Do the maths! That would mean that each one of our 66 million population, from infant child to aged pensioner, on average uses 636 straws a year. Is this credible? BBC Reality Check looked into this, and a very different claim made by DEFRA (8.5 billion/year), and found that both figures came from the consultancy ‘Eunomia’, whose estimating methodologies and maths are open to question.
To be fair to journalists, it is hard for them to check facts too. In my slide deck I list a number of pressures on them. Amongst the most problematic are shrinking newsroom budgets and staffing, time pressures in the 24-hour news cycle, and more information coming in via tweets and social media and YouTube, especially from conflict and disaster zones abroad. There are projects and organisations trying to help journalists (and the public) through this maze; I have already mentioned Full Fact and First Draft, and a new one is DMINR from City University of London School of Journalism.
Group exercise: contested truths, trust in sources
Our seminar participants gathered in table groups of about six or seven. To the tables, I distributed five sheets each bearing a headline, referring to a fairly well-known (mostly UK-centric) current affairs issue, as follows:
- Anti-Semitism is rife in Labour Party leadership
- London threatened by wave of youth violence
- Global warming means we must de-carbonise
- Immigration responsible for UK housing crisis
- 9,500 die annually in London because of air pollution
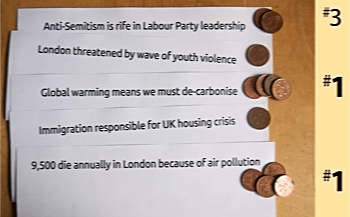
Using ‘divide the dollar’ with British pennies to rapidly select two of the topics to discuss.)
‘Divide the dollar’
I asked the teams to use a ‘divide-the-dollar’ game to quickly select two of the presented choices of topics on which their table would concentrate. (Each person took three coins, put two on their personal first choice, and one on their second choice; the group added up the result and adopted the two top scorers).
Tag and talk
I also presented a sheet of ‘tags’ denoting possible truth and comprehension issues which might afflict these narratives, such as ‘State-sponsored trolling’ or ‘hard to understand science’. Table groups were encourage to write tags onto the sheets for their chosen topics – quickly at first, without discussion – and then start deciding which of these factors were dominant in each case.
The final part of the exercise was to think about how we might start ‘fact-checking’ each news topic. Which information sources, or research methods, would you most trust in seeking clarity? Which would you definitely distrust? And finally, though in the time limit we didn’t really get into this, can people identify their own biases and filters, which might impede objective investigation of the issues?
A lively half-hour exercise ensued, with the environmental/pollution topics emerging on most tables as the favourite case studies. Problems getting to grips with the science was identified as a key difficulty in assessing claim and counter-claim about these. I then spent the last ten minutes pulling out some shared observations from the tables.
It was all a bit of a scramble, but NetIKX audiences like their chance to engage actively in small groups (it’s one of the USPs of NetIKX, which we try to do at most meetings), Perhaps it points its way to an exercise which could be repeated, if not in content, then using the same method around a different subject.
My own reflections
Disinformation and ‘fake news’ Interim Report. published by the House of Commons Digital, Culture, Media and Sport Committee in July 2018. The report lambasts the social media platforms, but is eerily silent about disinformation and slanted reporting in Britain’s tabloid press. (Download the report.)
I personally think that being sceptical of all sources of information is healthy, and none can demand our trust until they have earned it. This is true whatever the information channel. In that respect I agree with Brennan Jacoby, and with Baroness O’Neill.
Our seminar had focused primarily on political opinions and news stories, and in this field the control and manipulation of information is a weapon. To cope, on the one hand we need better access to fact-checking resources; on the other we need to understand the political agenda and motivations and pressures on each publisher and broadcaster — and, indeed, commercial or government or NGO entity which is trying to spin us a line.
Amongst librarians there are calls for promoting so-called ‘information literacy’ and critical thinking habits, from an early age. I would add that the related idea of ‘media literacy’ also has merit.
I have a strong interest in the field of science communication. Some of the most pressing problems of our age are best informed by science, including land and agriculture management, the treatment of diseases, climate change risks, future energy policy, and the challenges of healthcare. But here we have a double challenge: on the one hand, most people are ill-equipped to understand and evaluate what scientists say; on the other, powerful commercial and nationalist interests are working to undermine scientific truth and profit from our ignorance.
Two related aspects of science communication we might further look at are understanding risk, and understanding statistics. The information-and-knowledge gang keeps itself artificially apart from those who work with data and mathematics – that too would be a gulf worth bridging.
— Conrad Taylor, May 2018

The implications of blockchain for information management
/in Netikx/by NetikxAccount of a NetIKX meeting with Marc Stephenson & Noeleen Schenk (Metataxis),
and John Sheridan (The National Archives) — 6 July 2017.
by Conrad Taylor
Blockchain is a technology which was first developed as the technical basis for the cryptocurrency Bitcoin, but there has been recent speculation that it might be useful for various information management purposes too. There is quite a ‘buzz’ around the topic, yet it is too complex for many people to figure out, so it’s not surprising that the 6 July 2017 NetIKX seminar, ‘The implications of Blockchain for KM and IM’, attracted the biggest turnout of the year so far.
PDF available for download — This article is also available as a nicely formatted PDF, with some extra notes. Nine pages, 569 KB
The seminar took the form of three presentations, two from the consultancy Metataxis and one from The National Archive. The table group discussions which followed were simply open and unstructured discussions, with a brief period at the end for sharing ideas.
The subject was indeed complex and a lot to take in. In creating this piece I have gone beyond what we were told on the day, done some extra research, and added my own observations. I hope this will make some things clearer, and qualify some of what our speakers said, especially where it comes to technical details.
MARC STEPHENSON gives a technical overview
The first speaker was Marc Stephenson, Technical Director at Metataxis, the information architecture and information management consultancy. In the limited time available, Marc attempted a technical briefing.
Marc’s first point was that it’s not easy to define blockchain. It is not just a technology, but also a concept and a framework for ways of working with records and information; and it has a number of implementations, which differ in significant ways from each other. Marc suggested that, paradoxically, blockchain can be described as ‘powerful and simple’, but also ‘subtle, and difficult to understand’. Even with two technical degrees under his belt, Marc confessed it had taken him a while to get his head around it. I sympathise!
The largest and best-known implementation of blockchain so far is the infrastructure for the digital cryptocurrency ‘Bitcoin’ – so much so that many people get the two confused (and others, in my experience, think that some of the features of Bitcoin are essential to blockchain – I shall be suggesting otherwise).
Wikipedia (at https://en.wikipedia.org/wiki/Blockchain offers this definition:
Marc then dug further into this definition, but in a way which left some confused about what is specific to Bitcoin and what are the more generic aspects of blockchain. Here, I have tried to tease these apart.
Distributed database — Marc said that a blockchain is intended to be a massively distributed database, so there may be many complete copies of the blockchain data file on server computers in many organisations, in many countries. The intention is to avoid the situation in which users of the system have to trust a single authority.
I am sceptical as to whether blockchains necessarily require this characteristic of distribution over a peer-to-peer network, but I can see that it is valuable where there are serious issues of trust at stake. As we heard later from The National Archive, it is also possible to create similar distributed ledger systems shared between a smaller number of parties which already trust each other.
Continuously growing chain of unalterable ‘blocks’ — The blockchain database file is a sequential chain divided into ‘blocks’ of data. Indeed, when blockchain was first described by ‘Satoshi Nakamoto’, the pseudonymous creator of the system in 2008, the phrase ‘block chain’ was presented as two separate words. When the database is updated by a new transaction, no part of the existing data structure is overwritten. Instead, a new data block describing the change or changes (in the case of Bitcoin, a bundle of transactions) is appended to the end of the chain, with a link that points back to the penultimate (previous) block; which points back to the previous one; and so on back to the ‘genesis block’.
One consequence of this data structure is that a very active blockchain that’s being modified all the time grows and grows, potentially to monstrous proportions. The blockchain database file that maintains Bitcoin has now grown to 122 gigabytes! Remember, this file doesn’t live on one centralised server, but is duplicated many times across a peer-to-peer network. Therefore, a negative consequence of blockchain could be the enormous expense of computing hardware resources and energy involved in a blockchain system.
(As I shall later explain, there are some peculiar features of Bitcoin which drive its bloat and its massive use of computational resources; for blockchains in general, it ain’t necessarily so.)
Timestamping — when a new block is created at the end of a chain, it receives a timestamp. The Bitcoin ‘timestamp server’ is not a single machine, but a distributed function.
Encryption — According to Marc, all the data in a blockchain is encrypted. More accurately, in cryptocurrency system, crucial parts of the transaction data do get encrypted, so although the contents of the blocks are a matter of public record, it is impossible to work out who was transferring value to whom. (It is also possible to implement a blockchain without any encryption of the main data content.)
Managed autonomously — For Bitcoin, and other cryptocurrencies, the management of the database is done by distributed software, so there is no single entity, person, organisation or country in control.
Verifiable blocks — It’s important to the blockchain concept that all the blocks in the chain can be verified by anyone. For Bitcoin, this record is accessible at the site bitcoin.info.
Automatically actionable — In some blockchain systems, blocks may contain more than data; at a minimum they can trigger transfers of value between participants, and there are some blockchain implementations – Ethereum being a notable example – which can be programmed to ‘do’ stuff when a certain condition has been met. Because this happens without user control, without mediation, all of the actors can trust the system.
Digging into detail
In this section, I am adding more detail from my own reading around the subject. I find it easiest to start with Bitcoin as the key example of a blockchain, then explore how other implementations vary from it.
‘Satoshi Nakamoto’ created blockchain in the first place to implement Bitcoin as a digital means to hold and exchange value – a currency. And exchange-value is a very simple thing to record, really, whereas using a blockchain to record more complex things such as legal contracts or medical records adds extra problems – I’ll look at that later. Let’s start by explaining Bitcoin.
Alice wants to pay Bob. Alice ‘owns’ five bitcoins – or to put it more accurately, the Bitcoin transaction record verifies that she has an entitlement to that amount of bitcoin value: the ‘coins’ do not have any physical existence. She might have purchased them online with her credit card, from a Bitcoin broker company such as eToro. Now, she wants to transfer some bitcoin value to Bob, who in this story is providing her with something for which he wants payment, and has emailed her an invoice to the value of 1.23 BTC. The invoice contains a ‘Bitcoin address’ – a single-use identifier token, usually a string of 34 alphanumeric characters, representing the destination of the payment.
To initiate this payment, she needs some software called a ‘Bitcoin wallet’. Examples are breadwallet for the iPhone and iPad, or Armory for Mac, Linux and Windows computers. There are also online wallets. Users may think, ‘the wallet is where I store my bitcoins’. More accurately, the wallet stores the digital credentials you need to access the bitcoin values registered in the blockchain ledger against your anonymised identity.
Launching her wallet, Alice enters the amount she wants to send, plus the Bitcoin address provided by Bob, and presses Send.
For security, Alice’s wallet uses public-private key cryptography to append a scrambled digital signature to the resulting message. By keeping her private key secret, Alice is guaranteed that no-one can spoof Bitcoin into thinking that the message was sent to the system by anyone else other than her. The Bitcoin messaging system records neither Alice’s nor Bob’s identity in the data record, other than in deeply encrypted form: an aspect of Bitcoin which has been criticised for its ability to mask criminally-inspired transactions.
At this stage, Alice is initiating no more than a proposal, namely that the Bitcoin blockchain should be altered to show her wallet as that bit ‘emptier’, and Bob’s a bit ‘fuller’. Implementing computers on the network will check to see whether Alice’s digital signature can be verified with her public key, that the address provided by Bob is valid, and that Alice’s account does in fact have enough bitcoin value to support the transaction.
If Alice’s bitcoin transaction proposal is found to be valid and respectable, the transaction can be enacted, by modifying the blockchain database (updating the ledger, if you like). As Marc pointed out, this is done not by changing what is there already, but by adding a new block to the end of the chain. Multiple transactions get bundled together into one Bitcoin block, and the process is dynamically managed by the Bitcoin server network to permit the generation of just one new such block approximately every ten minutes – for peculiar reasons I shall later explain.
Making a block: the role of the ‘hash’
The blocks are generated by special participating servers in the Bitcoin network, which are called ‘miners’ because they get automatically rewarded for the work they do by having some new Bitcoin value allocated to them.
In the process of making a block to add to the Bitcoin blockchain, the first step is to gather up the pending transaction records, which are placed into the body of the new block. These transaction records themselves are not encrypted, though the identities of senders and receivers are. I have heard people say that the whole blockchain is irreversably encrypted, but if you think about it for a second, this has to be nonsense. If the records were rendered uninspectable, the blockchain would be useless as a record-keeping system!
However, the block as a whole, and beyond that the blockchain, has to be protected from accidental or malicious alteration. To do this, the transaction data is put through a process called ‘cryptographic hashing’. Hashing is a well-established computing process which feeds an arbitrarily large amount of data (the ‘input’ or ‘message’) through a precisely defined algorithmic process, which reduces it down to a fixed-length string of digits (the ‘hash’). The hashing algorithm used by Bitcoin is SHA-256, created by the US National Security Agency and put into the public domain.
By way of example, I used the facility at http://passwordsgenerator.net/sha256-hash-generator/ to make an SHA-256 hash of everything in this article up to the end of the last paragraph (in previous edits, I should add; I’ve made changes since). I got 9F0B 653D 4E6E 7323 4E03 B04C F246 4517 8A96 DFF1 7AA1 DA1B F146 6E1D 27B0 CA75 (you can ignore the spaces).
The hash string looks kind of random, but it isn’t – it’s ‘deterministic’. Applying the same hashing algorithm to the same data input will always result in the same hash output. But, if the input data were to be modified by even a single character or byte, the resulting hash would come out markedly different.
Note that the hash function is, for all practical purposes, ‘one-way’. That is, going from data to hash is easy, but processing the hash back into the data is impossible: in the case of the example I just provided, so much data has been discarded in the hashing process that no-one receiving just the hash can ever reconstitute the data. It is also theoretically possible, because of the data-winnowing process, that another set of data subjected to the same hashing algorithm could output the same hash, but this is an extremely unlikely occurrence. In the language of Bitcoin, the hashing process is described as ‘collision-resistant’.
The sole purpose of this hashing process is to build a kind of internal certificate, which gets written into a special part of the block called the ‘header’. Here, cryptography is not being used to hide the transaction data, as it might in secret messaging, but to provide a guarantee that the data has not been tampered with.
Joining the hash of the transaction data in the header are some other data, including the current timestamp, and a hash of the header of the preceding block in the chain. These additions are what gives the blockchain its inherent history, for the preceding block also contained a hash of the header of the block before that, and so on down the line to the very first block ever made.
The role of the ‘miner’ in the Bitcoin system
Now, as far as I can tell, there is nothing in principle wrong with having the blockchain-building process run by one trusted computer, with the refreshed blockchain perhaps being broadcast out at intervals and stored redundantly on several servers as a protection against disaster.
But that’s not the way that Bitcoin chose to do things. They wanted the block-writing process to be done in a radically decentralised way, by servers competing against each other on a peer-to-peer network; they also chose to force these competing servers to solve tough puzzles which are computationally very expensive to process. Why?
Because intimately entangled in the way the Bitcoin ecology builds blocks, is the way that new bitcoins are minted; at present the ‘reward’ from the system to a miner-machine for successfully solving the puzzle and making the latest block in the chain is a fee of 12.5 fresh new bitcoins, worth thousands of dollars at current exchange rates. That’s what motivates private companies to invest in mining hardware, and take part in the game.
This reward-for-work scheme is why the specialised computers that participate in the block-building competition are called ‘miners’.
Let’s assume that the miner has got as far through the process as verifying and bundling the transaction data, and has created the hash of the data for the header. At this point the Bitcoin system cooks up a mathematical puzzle based on the hash, which the ‘miner’ system making the block has to solve. These mathematical puzzles (and I cannot enlighten you more about their precise nature, it’s beyond me!) can be solved only by trial and error methods. Across the network, the competing miner servers are grinding away, trying trillions of possible answers, hashing the answers and comparing them to the header hash and the puzzle instructions to see if they’ve got a match.
This consumes a lot of computing power and energy – in 2014, one bitcoin ‘mining farm’ operator, Megabigpower in Washington state USA, estimated that it was costing 240 kilowatt-hours of electricity per bitcoin earned, the equivalent of 16 gallons of petrol. It’s doubtless gone up by now. The hashing power of the machines in the Bitcoin network has surpassed the combined might of the world’s 500 fastest supercomputers! (See ‘What is the Carbon Footprint of a Bitcoin?’ by Danny Bradbury: https://www.coindesk.com/carbon-footprint-bitcoin/).
When a miner ‘thinks’ it has a correct solution, it broadcasts to the rest of the network and asks other servers to check the result (and thanks to the hash-function check, though solving the problem is hard, checking the result is easy). All the servers which ‘approve’ the solution – strangely, it’s called a ‘nonce’ – will accept the proposed block, now timestamped and with a hash of the previous block’s header included to form the chainlink, and they update their local record of the blockchain accordingly. The successful miner is rewarded with a transaction which earns it a Block Reward, and I think collects some user transaction fees as well.
Because Bitcoin is decentralised, there’s always the possibility that servers will fall out of step, which can cause temporary forks and mismatches at the most recent end of the blockchain, across the network (‘loose ends’, you might call them). However, the way that each block links to the previous one, plus the timestamping, plus the rule that each node in the network must work with the longest extant version it can find, means that these discrepancies are self-repairing, and the data store is harmonised automatically even though there is no central enforcing agency.
The Bitcoin puzzle-allocation system dynamically adjusts the complexity of the puzzles so that they are being solved globally at a rate of about only six an hour. Thus although there is a kind of ‘arms race’ between competing miners, running on ever faster competing platforms, the puzzles just keep on getting tougher and tougher to crack, and this is what controls the slow increase in the Bitcoin ‘money supply’. Added to this is a process by which the rate of reward for proof-of-work is being slowly decreased over time, which in theory should make bitcoins increasingly valuable, rewarding the people who own them and use them.
As I shall shortly explain, this computationally expensive ‘proof-of-work’ system is not a necessary feature of blockchain per se, and other blockchains use a less expensive ‘proof-of-stake’ system to allocate work.
Disentangling blockchain from Bitcoin
To sum up, in my opinion the essential characteristics of blockchain in general, rather than Bitcoin in particular, are as follows (and compare this with the Wikipedia extract quoted earlier):
And I believe we can set aside the following features which are peculiarities of Bitcoin:<
The Bitcoin blockchain is a record of all the transactions which have ever taken place between all of the actors within the Bitcoin universe, which is why it is so giganormous (to coin a word). Blockchains which do not have to record value exchange transactions can be much smaller and non-global in scope – my personal medical record, for example, would need to journal only the experiences of one person.
All the data tracked by the Bitcoin blockchain has to live inside the blockchain; but blockchain systems can also be hybridised by having them store secure and verified links to other data repositories. And that’s a sensible design choice where the entire data bundle contains binary large objects (BLOBs) such as x-rays, scans of land title deeds, audio and video recordings, etc.
The wasteful and computationally expensive ‘proof of work’ test faced by Bitcoin miners is, to my mind, totally unnecessary outside of that kind of cryptocurrency system, and is a burden on the planet.
Marc shows a block
In closing his presentation, Marc displayed a slide image of the beginning of the record of block number 341669 inside the Bitcoin blockchain, from back in February 2015 when the ‘block reward’ for solving a ‘nonce’ was 25 Bitcoins. You can follow this link to examine the whole block on bitcoin.info: https://blockchain.info/block/0000000000000000062e8d7d9b7083ea45346d7f8c091164c313eeda2ce5db11. The PDF version of this article contains some screen captures of this online record.
That block carries records of 1,031 transactions, of a value of 1,084 BTC, and it is about 377 KB in size (and remember, these blocks add up!) The transaction record data can be clearly read, even thought it will not make much sense to human eyes because of the anonymisation provided by the encrypted user address of the sender, and the encrypted destination address for the receiver. Thus all we can see that ‘17p3BWzFeqh7DLELpodxt2crQjisvDbC95’ sent 50 BTC to ‘1HEhEpnDhRMUEQSxSWeV3xBoxdSHjfMZJ5’
Other cryptocurrencies, other blockchain methods
Bitcoin has had quite a few imitators; a July 17 article by Joon Ian Wong listed nine other cryptocurrencies – Ethereum, Etherium Classic, Ripple, Litecoin, Dash, NEW, IOTA, Monero and EOS. (Others not mentioned include Namecoin, Primecoin, Nxt, BlackCoin and Peercoin.) That article also points to how unstable the exchange values of cryptocurrencies can be: in a seven-day period in July, several lost over 30% of their dollar values, and $7 billion of their market value was wiped out!
From our point of view, what’s interesting is a couple of variations in how alternative systems are organised. Several of these systems have ditched the ‘proof-of-work’ competition as a way of winning the right to make the next block, in favour of some variant of what’s called ‘proof-of-stake’.
As an example, consider Nxt, founded in late 2013 with a crowdsourced donation campaign. A fixed ‘money’ supply of a billion NXT coins was then distributed, in proportion initially to the contributions made; from this point, trading began. Within the Nxt network, the right to ‘forge’ the next block in the transaction record chain is allocated partly on the basis of the amount of the currency a prospective ‘forger’ holds (that’s the Stake element), but also on the basis of a randomising process. Thus the task is allocated to a single machine, rather than being competed for; and without the puzzle-solving element, the amount of compute power and energy required is slight – the forging progess can even run on a smartphone! As for the rewards for ‘playing the game’ and forging the block, the successful block-forger gains the transaction fees.
Marc specifically mentioned Ethereum, founded in 2014–15, the currency of which is called the ‘ether’. In particular he referred to how Ethereum supports ‘Smart Contracts’, which are exchange mechanisms performed by instructions in a scripting language being executed on the Etherium Virtual Machine – not literally a machine, but a distributed computing platform that runs across the network of participating servers. Smart contracts have been explored by the bank UBS as a way of making automated payments to holders of ‘smart bonds’, and a project called The DAO tried to use the Etherium platform to crowdfund venture capital. The scripts can execute conditionally – the Lighthouse project is a crowdfunding service that makes transfers from funders to projects only if the funding campaign target has been met.
Other uses of blockchain distributed ledgers
In October 2015, a feature article in The Economist pointed out that ‘the technology behind bitcoin lets people who do not know or trust each other build a dependable ledger. This has implications far beyond the cryptocurrency.’ One of the areas of application they highlighted was the secure registration of land rights and real estate transactions, and a pioneer in this has been Lantmäteriet, Sweden’s Land Registry organisation.
Establishing a blockchain-based publicly inspectable record about the ownership (and transfer of ownership) of physical properties poses some different problems than those which simply transfer currency. The base records can include scans of signed contracts, digital photos, maps and similar objects. What Lantmäteriet aims to collect in the blockchain are what it dubs ‘fingerprints’ for these digital assets – SHA-256 hashes computed from the digital data. You cannot tell from a fingerprint what a person looks like, but it can still function as a form of identity verification. As a report on the project explains:
‘A purchasing contract for a real estate transaction that is scanned and becomes digital is an example. The hash that is created from the document is unique. For example, if a bank receives a purchasing contract sent via email, the bank can see that the document is correct. The bank takes the document and run the algorithm SHA-256 on the file. The bank can then compare the hash with the hash that is on the list of verification records, assuming that it is available to the bank. The bank can then trust that the document really is the original purchasing contract. If someone sends an incorrect contract, the hash will not match. Despite the fact that email has a low level of security, the bank can feel confident about the authenticity of the document.’
(‘The Land Registry in the blockchain’ —
http://ica-it.org/pdf/Blockchain_Landregistry_Report.pdf)
In the UK, Her Majesty’s Land Registry has started a project called ‘Digital Street’ to investigate using blockchain to allow property ownership changes to to close instantaneously. Greece, Georgia and Honduras have similar projects underway.
In Ghana, there is no reliable nationwide way of registering ownership of land and property, but a nonprofit project called Bitland is drawing up plans for a blockchain-verified process for land surveys, agreements and documentation which – independent of government – will provide people with secure title (www.bitland.world). As they point out, inability to prove ownership of land is quite common across Africa, and means that farmers cannot raise bank capital for development by putting up land as security.
Neocapita is a company which is developing Stoneblock as a decentralised blockchain-based registration service for any government-managed information, such as citizen records. They are working in collaboration with the United Nations Development Program, World Vision, and two governments (Afghanistan and Papua New Guinea), initially around providing a transparent record of aid contributions, and land registry.
NOELEEN SCHENK on blockchain and information governance
After Marc Stephenson had given his technical overview of Blockchain, Noeleen Schenk (also of Metataxis) addressed the issue of what these developments may mean for people who work with information and records management, especially where there are issues around governance.
Obviously there is great interest in blockchain in financial markets, securities and the like, but opportunities are also being spotted around securing the integrity of the supply chain and proving provenance. Walmart is working with IBM on a project which would reliably track foodstuffs, from source to shelf. The Bank of Canada is looking towards using blockchain methods to verify customer identities onwards, on the basis that the bank has already gone through identity checks when you opened your account. Someone in the audience pointed out that there are also lots of applications for verified records of identity in the developing world, and Noeleen mentioned that Microsoft and the UN are looking at methods to assist the approximately 150 million people who lack proof of identity.
Google DeepMind Health is looking at using some blockchain-related methods around electronic health records, in a concept called ‘Verifiable Data Audit’ which would automatically record every interaction with patient data (changes, but also access). They argue that health data needn’t be as radically decentralised as in Bitcoin’s system – a federated structure would suffice – nor is proof-of-work an appropriate part of the blockmaking process in this context. The aim is to secure trust in the data record (though ironically, DeepMind’s was recently deemed to have handled 1.6 million Royal Free Hospital patient records inappropriately).
Noeleen referred to the ISO standard on records management, ISO 15489-1, which gives as the characteristics of ‘authoritative records’ – meeting standards for authenticity, reliability, integrity and usability. What has blockchain to offer here?
Well, where a blockchain is managed on a decentralised processing network, one advantage can be distributed processing power, and avoidance of the ‘single point of failure’ problem. The use of cryptographic hashes ensures that the data has not been tampered with, and where encryption is used, it helps secure data against unauthorised access in the first place.
Challenges to be solved
Looking critically at blockchain with an information manager’s eye, Noeleen noticed quite a few challenges, of which I highlight some:
Private blockchains are beginning to make their appearance in various sectors (the Walmart provenance application is a case in point). This raises questions of what happens when different information management systems need to interoperate.
In many information management applications, it is neither necessary nor desirable to have all of the information actually contained within the block (the Lantmäteriet system is a case in point). Bringing blockchain into the picture doesn’t make the problem of inter-relating datasets go away.
Blockchain technology will impact the processes by which information is handled, and people’s roles and responsibilities with that process. Centres of control may give way to radical decentralisation.
There will be legal and regulatory implications, especially where information management systems cross different jurisdictions.
Noeleen has noticed that where people gather (with great enthusiasm) to discuss what blockchain can do, there seems to be very poor awareness amongst them of well-established record-keeping theory, principles, and normal standards of practice. The techies are not thinking about information management requirements enough.
These issues require information professionals to engage with the IT folks, and advocate the incorporation of information and record keeping principles into blockchain projects, and the application of information architectural rigour.
INTERMEDIATE DISCUSSION
Following Noeleen’s presentation, there were some points raised by the audience. One question was how, where the blockchain points to data held externally, that external data can itself be verified, and how it can be secured against inappropriate access.
Someone made the point that is is possible to set up a ‘crypotographic storage system’ in which the data is itself encrypted on the data server, using well established public-private key encryption methods, and therefore accessible only to those who have access to the appropriate key. As for the record in the blockchain, what that stores could be the data location, plus the cryptographic hash of the data, so that any tampering with the external data would be easy to detect.
What blockchain technology doesn’t protect against, is bad data quality to start with. I’m reminded of a recent case in which it emerged that a sloppy clinical coder had entered a code on a lady’s record, indicating that she had died of Sudden Infant Death Syndrome (happily, she was very much alive). That transaction can never be erased from the blockchain – but it doesn’t stop the record being corrected after.
JOHN SHERIDAN:
Blockchain and the Archive: the TNA experience
Our third presentation was from John Sheridan, the Digital Director at The National Archives (TNA), with the title ‘Application of Distributed Ledger Technology’. He promised to explain what kinds of issues the Archive worries about, and where they think blockchains (or distributed ledgers more generally) might help. On the digital side of TNA, they are now looking at three use-cases, which he would describe.
John remarked that the State gathers information ‘in order to make Society legible to it’ – so that it might govern. Perhaps The Domesday Book was one of the world’s first structured datasets, collected so that the Norman rulers might know who owned what across the nation, for taxation purposes. The Archive’s role, on the other hand, is to enable the citizen to see the State, and what the State has recorded, by perusing the record of government (subject to delays).
Much of the ethos of the TNA was set by Sir Hilary Jenkinson, of the Public Record Office (which merged with three other bodies to form TNA in 2003). He was a great contributor to archive theory, and in 1922 wrote A Manual of Archive Administration (text available in various formats from The Internet Archive, https://archive.org/details/manualofarchivea00jenkuoft). TNA still follows his attitude and ideas about how information is appraised and selected, how it is preserved, and what it means to make that information available.
An important part of TNA practice is the Archive Descriptive Inventory – a hierarchical organisation of descriptions for records, in which is captured something of the provenance of the information. ‘It’s sort of magnificent… it kind of works,’ he said, comparing it to a steam locomotive. But it’s not the best solution for the 21st century. It’s therefore rather paradoxical that TNA has been running a functional digital archive with a mindset set that is ‘paper all the way down’ – a straight line of inheritance from Jenkinson, using computers to simulate a paper record.
Towards a second-generation digital archive
It’s time, he said, to move to a second-generation approach to digital archive management; and research into disruptive new technologies is important in this.
For the physical archive, TNA practice has been more or less to keep everything that is passed to it. That stuff is already in a form that they can preserve (in a box), and that they can present (only eyes required, and maybe reading spectacles). But for the digital archive, they have to make decisions against a much more complex risk landscape; and with each generation of technological change, there is a change in the digital preservation risks. TNA is having to become far more active in making decisions about what evidences the future may want to have access to; and, which risks they will seek to mitigate, and which ones they won’t.
They have decided that one of the most important things TNA must do, is to provide evidence for purposes of trust – not only in the collection they end up with, but also in the choices that they have made in respect of that collection. Blockchain offers part of that solution, because it can ‘timestamp’ a hash of the digital archive asset (even if they can’t yet show it to the public), and thereby offer the public an assurance, when the archive data is finally released, that it hasn’t been altered in the meantime.
Some other aims TNA has in respect of the digital archive is being more fluid about how an asset’s context is described; dealing with uncertainties in provenance, such as about when a record was created; and permitting a more sophisticated, perhaps graduated form of public access, rather than just now-you-can’t-see-it, now-you-can. (They can’t simply dump everything on the Web – there are considerations of privacy, of the law of defamation, of intellectual property and more besides.)
The Archangel project
Archangel is a brand new project in which TNA is engaged together with the University of Surrey’s Centre for the Digital Economy and the Open Data Institute. It is one of seven projects which EPSRC is funding to look at different contexts of use for distributed ledger technology. Archangel is focused specifically on public digital archives, and they will try to work with a group of other memory institutions.
The Archangel project will not be using the blockchain methods which Marc had outlined. Apparently, they have their own distributed ledger technology (DLT), with ‘permissioned’ access.
The first use-case, which will occupy them for the first six months, will focus on a wide variety of types of research data held by universities: they want to see if they can produce sets of hashes for such data, such that at a later date when the findings of the research are published, and the data is potentially archived, any question of whether the data has been tampered with or manipulated can be dealt with by cryptographic assurance spread across a group of participating institutions. (The so-called ‘Climategate’ furore comes to mind.)
The second use-case is for a more complex kind of digital object. For example, TNA preserves the video record of proceedings of The Supreme Court. In raw form, one such digital video file could weigh in at over a terabyte! Digital video transcoding methods, including compression algorithms, are changing at a rapid pace, so that in a decade’s time it’s likely that the digital object provided to the public will have to have been converted to a different file format. How is it possible to create a crypographic hash for something so large? And is there some way of hashing not the bit sequence, but the informational content in the video?
It’s also fascinating to speculate about how machines in future might be able to interpret the informational content in a video. At the moment, a machine can’t interpret the meaning in someone’s facial expressions – but maybe in the future?
For this, they’ll be working with academics who specialise in digital signal processing. They are also starting to face similar questions with ‘digital surrogates’ – digital representations of an analogue object.
The third use case is about Deep Time. Most people experimenting with blockchain have a relatively short timescale over which a record needs to be kept in verifiable form, but the aspirations of a national archive must looks to hundreds, maybe thousands of years.
Another important aspect of the Archangel project is the collaboration which is being sought between memory institutions, which might reach out to each other in a concerted effort to underscore trust in each others’ collections. On a world scale this is important because there are archives and collections at significant risk – in some places, for example, people will turn up with Kalashnikovs to destroy evidence of human rights abuses.
Discussions and some closing thoughts
TABLE-GROUP DISCUSSIONS: NetIKX meetings typically feature a ‘second half’ which is made up of table-group discussions or exercises, followed by a summing-up plenary discussion. However, the speakers had not organised any focused discussion topics, and certainly the group I was in had a fairly rambling discussion trying to get to grips with the complexity and novelty of the subject. Likewise, there was not much ‘meat’ that emerged in the ten minutes or so of summing up.
One suggestion from Rob Begley, who is doing some research into blockchain, was that we might benefit from reading Dave Birch’s thoughts on the topic – see his Web site at http://www.dgwbirch.com. However, it’s to be borne in mind that Birch comes at the topic from a background in electronic payments and transactions.
MY OWN CLOSING THOUGHTS: There is a lot of excitement – one might say hype – around blockchain. As Noeleen put it, in the various events on blockchain she had attended, a common attitude seems to be ‘The answer is blockchain! Now, what was the problem?’ As she also wisely observed, the major focus seems to be on technology and cryptocurrency, and the principles of information and records management scarcely get a look-in.
The value of blockchain methods seem to centre chiefly on questions of trust, using a cryptographic hashing and a decentralised ledger system to create a hard-to-subvert timestamped record of transactions between people. The transactional data could be about money (and there are those who suggest it is the way forward for extending banking services in the developing world); the application to land and property registration is also very promising.
Another possible application I’m interested in could be around ‘time banking’, a variant of alternative currency. For example in Japan, there is a scheme called ‘Fureai Kippu’ (the ‘caring relationship ticket’) which was founded in 1995 by the Sawayaka Welfare Foundation as a trading scheme in which the basic unit of account is an hour of service to an elderly person who needs help. Sometimes seniors help each other and earn credits that way, sometimes younger people work for credits and transfer them to elderly relatives who live elsewhere, and some people accumulate the credits themselves against a time in later life when they will need help. It strikes me that time-banking might be an interesting and useful application of blockchain – though Fureai Kippu seems to get on fine without it.
When it comes to information-management applications which are non-transactional, and which involve large volumes of data, a blockchain system itself cannot cope: the record would soon become impossibly huge. External data stores will be needed, to which a blockchain record must ‘point’. The hybrid direction being taken by Sweden’s Lantmäteriet, and the Archangel project, seems more promising.
As for the event’s title ‘ The implications of Blockchain for KM and IM’ — my impression is that blockchain offers nothing to the craft of knowledge management, other than perhaps to curate information gathered in the process.
Some reading suggestions
Four industries blockchain will disrupt
‘Two billion people lack access to a bank account. Here are 3 ways blockchain can help them’
TED talk, Don Tapscott on how the blockchain is changing money and business
Why Ethereum holds so much promise
Wikipedia also has many valuable articles about blockchain, cryptographic hashing, etc
Blog for the June 2018 seminar in Leeds.
/in Netikx, Uncategorised/by NetikxIn June 2018, NetIKX held a seminar led by NetIKX in cooperation with ISKO UK. We were proud to have a meeting outside London to offer more to our members. Our main speaker, Ewan David, Talked about a particular aspect of the electronic medical records system. He hoped that future development in this area would be based on open standards. Conrad Taylor contributed an interesting overview of background information highlighting that information and knowledge are central to the practice of medicine. This means that for modern medicine there is pressure to use digital systems to improve patient care and increase knowledge sharing. But the application of computers to health care and patient records is complex, involving as it does confidential patient records.
Ewan David has been active in health informatics for over 35 years. He is an independent consultant, both with NHS bodies as well as on the industrial provider side. He has also been the chair of the British Computer Society Primary Healthcare Group. He is now CEO of Inidus a new company committed to delivering a secure cloud-based platform for health and social care applications. He advocates an approach that seeks to end vendor lock-in in order to liberate data.
Digital technologies have delivered transformational change in banking, finance, travel and retail, do there appears to be a big opportunity to the same for healthcare. However progress so far has resulted in data silos. The GP practice has a system; the hospital site could have many systems, storing data in proprietary formats making it difficult to share data between them. Once systems are in place there is a heavy penalty in terms of time and focus that makes change unlikely. The vendor market for big hospital system is dominated by four American companies. The picture is similar in the pharmacy sector, and also maternity systems. There has been no significant new entrant to the UK digital health market for 25 years. As a result there is very little innovation and this blocks transformational change. The technology and business models are locked into the last century and there is little motivation to change.
Ewan believes there is a need to move to Open Platforms. This would make the data that healthcare applications need available in an open, computable, shareable format. The information needed is data about an individual patient, medical knowledge and information about resources available to call on. What any clinician does, and therefore what supporting applications need to do, is to combine these kinds of information so that the patient’s health issues can be diagnosed, and a course of action chosen within the constraints of the resources available.
There are barriers to entry to the healthcare technology market – regulatory barriers and issues of privacy and clinical safety. The commercial environment is difficult for new entrants to the market. Using open platforms could open up to new suppliers as you work with a vendor neutral information model and clear standards that any application will comply with. This allows purchasers to move between vendors without the need to transform the underlying data. Some experiments have been done so far. One by Moscow City Council and another with Leeds in the UK. Using open standards has allowed more involvement from the people who know healthcare intimately – the practitioners. The benefits of the system is that work can be done on limited areas and then combined rather than producing an overarching system that attempts to do everything. Components of the system can then be changed much more easily, removing one of the major barriers to innovation.
After this important talk, we moved to discussion which was lively and enthusiastic. The discussion ranged from how patients could be involved in producing appropriate records, some of the useful innovations recently seen in healthcare systems and the relevance of anonymised research data. We considered the road that would be needed to move towards more flexible and appropriate systems. Ewan summed up the successful seminar by reiterating that a more open system is what is needed and that most in the health service agree it makes sense. However, it is likely to be a slow process to persuade the major vendors to commit to progressively opening up the data. But hopefully commissioners will have some leverage over the vendors and change will happen.
This blog is an extract from a report by Conrad Taylor.
For the full report please follow this link: Organising Medical and Health Related Information
June 2018 Seminar: Organising Medical and Health-related Information
/in Events 2018, Harnessing the web for information and knowledge exchange, Previous Events/by NetikxSummary
At this meeting held in Leeds, Ewan Davis, one of the first developers of a GP computerised health record system, discussed Electronic Health Records. This is a joint meeting with ISKO UK.
Speakers
Ewan Davis was one of the first developers of a GP computerised health record system. His background is solidly in Health Informatics and more recently he has been championing two things: the use of apps on handheld devices to support medical staff, patients and carers, and the use of open (non-proprietary) standards and information exchange formats in health informatics. Indeed, he is not long back from a launch in Plymouth by the local NHS trust of an integration system based on the OpenEHR standard – see https://en.wikipedia.org/wiki/OpenEHR. We also hope to have a second speaker on other aspects of EHR.
Time and Venue
2pm on 7th June 2018, The British Dental Association, 64 Wimpole Street, London W1G 8YS
Pre Event Information
This meeting, NetIKX’s first outside London for several years, will focus on health-related information. The main speakers will be Ewan Davis, who has pioneered Electronic Health Records (EHR) and, in particular, the relationship between clinical EHR (prepared by medical professionals), Personal Health Records (PHR), which are managed by individuals themselves, and Co-produced PHR, which is a proposal for a hybrid between these two types of record.
Slides
No slides available for this presentation
Tweets
Due to a power cut there were no tweets from this event
Blog
See our blog report: Organising Medical and Health Related Information
Study Suggestions
Our partner organisation can be found here
Trust and Integrity in Information
/in Netikx, Protecting information and knowledge/by NetikxTrust and Integrity in Information
An account by Conrad Taylor of the May 2018 meeting of the Network for Information and Knowledge Exchange. Speakers — Hanna Chalmers of Ipsos MORI, Dr Brennan Jacoby of Philosophy at Work, and Conrad Taylor.
Fake News 1688: the ‘Popish Plot’. Titus Oates ‘revealing’ to King Charles II his totally fabricated tale of a plot to assassinate the monarch: many accused were executed.
(Listen to BBC’s ‘In Our Time’ podcast.)
Background
In the last couple of years there has been much unease about whether the news, information and opinions we find in the media can be trusted. This applies not only to the established print and broadcast media, but also the new digital media – all further echoed and amplified, or undermined, by postings, sharing, comments and trollings on social media platforms.
In the last two years, as news channels were dominated by a divisive US presidential election, and the referendum on whether Britain should leave the EU, various organisations concerned with knowledge and information have been sitting up and paying attention – in Britain, led by the Chartered Institute of Library and Information Professionals (CILIP), and the UK chapter of the International Society for Knowledge Organization (ISKO UK). The Committee of NetIKX also determined to address this issue, and so organised this afternoon seminar.
The postmodern relativism of the 1980s seems back to haunt us; the concept of expertise has been openly rubbished by politicians. Nevertheless, as information and knowledge professionals, we still tend to operate with the assumption that there are objective truths out there. Taking decisions on the basis of true facts is something we value – whether for managing our personal well-being, or contributing to democratic decision-making.
Before this seminar was given its title, the Committee referred to it as being about the problem of ‘fake news’. But as we put it together, it became more nuanced, with two complementary halves. The first half, curated by Aynsley Taylor, focused on measuring people’s trust in various kinds of media, and what this ‘trust’ thing is anyway. The second half, which I curated and included a game-like group discussion exercise, looked at causes and symptoms of misinformation in the media, and how (and with whom) we might check facts.
Ipsos MORI: a global study of trust in media
Our first speaker was Hanna Chalmers of Ipsos MORI, a global firm known to the UK public for political polling, but which has as its core business helping firms to develop viable products, testing customer expectation and experience, and doing research for government and the public sector. Hanna is a media specialist, having previously worked at the BBC, and as Head of Research at Universal Music, before switching to the agency side.
Hanna presented a ‘sneak preview’, pre-publication, of Ipsos MORI research into people’s opinions about the trustability of different forms of media. This 26-country global study had 27,000 survey respondents, and encompassed most developed markets. The company put up its own money for this, to better inform conversations with clients, and to test at scale some hypotheses they had developed internally. Hanna warned us not to regard the results as definitive; Ipsos MORI sees this as the first iteration of an ongoing enquiry, but already providing food for thought.
Issues of trust in media formerly had a low profile for commerce, but is now having an impact on many of Ipsos MORI’s clients. (Even if a company has no political stance of its own, it has good reason not to be seen advertising in or otherwise supporting media sources popularly perceived as ‘toxic brands’.)
The study’s headline findings suggest that the ‘crisis of trust in the media’ that commentators warn about may not be as comprehensive and universal as is thought. However, in the larger and more established economies, a significant proportion of respondents claim that their trust in media has declined over the last five years.
Defining ‘trust’
Trust, said Hanna, is a part of almost every interaction in everyday life. (If you buy a chicken from a supermarket, for example, you trust it has been handled properly along the supply chain.) However, what trust actually means in any given circumstance is highly dependent on context.
The Ipsos MORI team chose this working definition: Trust broadly characterises a feeling of reasonable confidence in our ability to predict behaviour. They identified two elements for further exploration, based on the ideas of Stephen MR Covey, an American author.
1. Is the action committed with a good intention? Does the other party act with our best interests at heart? In the case of a news media outlet, that would imply them acting with integrity, working towards an error-free depiction of events. However, the definition of ‘best interest’ is nowadays contentious. Many people seek news sources that reflect their own point of view, rejecting what is counter to their opinions.
2. Does the other party reliably meet their obligations? In the case of media, defining obligations is not easy. Not all media outlets aim to provide an objective serving of facts; many are undoubtedly partisan. Within new media, much blog content is opinion presented as fact; where sources are cited, they are often unreliable. The news media world is pervaded by a mix of reportage, opinion and advertising, re-written PR and spin, making media more difficult to trust than other spheres of discourse.
Why is trust in media so precarious?
Hanna invited the audience to offer possible answers to this; we responded:
And let’s not blame only the media. Hanna cited a 2015 study by Columbia University and the French National Institute, which found that in 59% of instances of link-sharing on social media (e.g. Facebook), the sharer had not clicked through to check out the content of the link. (See Washington Post story in The Independent, 16 June 2016.)
How the survey worked
As already described, the survey engaged in January 2018 with 27,000 people, across 26 countries, and asked about their levels of trust in the media. The sample sets were organised to be nationally representative of age, gender and educational attainment.
The questions asked included:
a reliable source of news and information?
[See below for explanation of what ‘the following’ were.]
news and information that is relevant to you?
with good intentions in providing you with news and information?
has changed in the past five years?
the news and information provided to you by each of the following?
(This was accompanied by a definition of ‘fake news’ as ‘often sensational
information disguised as factual news reporting’.)
‘The following’ were, for each of these questions, five different classes of information source – (a) newspapers as a class, (b) social media as a class, (c) radio television as a class, (d) people we know in real life, and (e) people whom we know only through the Internet.
(In response to questions from the audience, Hanna explained that to break it down to an assessment of trust in particular ‘titles’, e.g. trust in RT vs BBC, or trust in The Guardian vs The Daily Express, would have been too complicated. It would have also made inter-country comparisons impossible.)
In parallel, the team conducted a literature review of other studies of trust in the media.
Hanna’s observations
Perhaps the decline in trust in advanced economies is because the recent proliferation of media channels (satellite TV, social media, news websites, online search and reference sources) means we have a broader swathe of resources for fact-checking, and which expose us to alternative narratives. That doesn’t necessarily mean we trust these alternatives, but awareness of a disparity of narratives may drive greater scepticism.
But driving in the other direction, the rise of social media magnifies the ‘echo chamber’ phenomenon where people cluster around entrenched positions, consider alternative narratives to be untruths, and social polarisation increases.
With the proliferation of media channels, competition for eyes and ears, and a scramble to secure advertising revenue, even long-established media outlets are trying to do more with fewer people – and making mistakes in the process. Social media helps those mistakes and inaccuracies take on lives of their own, before they can be corrected.
‘There is a propensity for consumers to skewer brands that mess up, and remember it’ said Hanna. ‘But it also leads to less than ideal shows of transparency [by brands] after mistakes happen.’ As an example, she mentioned the Equifax credit-rating agency’s data breach of May–July 2017, when personal details of 140+ million people were hacked. It took months for Equifax to come clean about it.
Why is there more trust in the media from people with higher levels of education? Hanna suggested it may be because they are more confident in their ability to discriminate and evaluate between news sources. (Which is paradoxical, in a way, if ‘greater trust in media’ equates to ‘more critical consumption of media’ – something we later explored in discussion.)
Trust, however, remains fairly robust overall, especially in print media, and big broadcast sources such as TV and radio. The category which Ipsos MORI labelled as ‘online websites’ was trusted markedly less. (For them, this label means news and information sites not linked to a traditional publishing model – thus the ‘BBC News’ website would not be counted by Ipsos MORI as an ‘online website’.)
Carrying the study forward
Ipsos MORI wants to carry this work forward, and has set up a global workstream for it. Meanwhile, what might the media themselves take away from this study? Hanna offered these thoughts:
In closing, Hanna quoted the American sociologist Ronald S Burt: ‘The question is not whether to trust, but who to trust’. Restoring equilibrium and strengthening trust in the media is important for democracy. She suggested that media owners and communicators need to take responsibility for the accuracy and trustability of their communications.
Questions and comments for Hanna
One audience member wondered if differing levels of trust had shown up across the gender divide. Hanna replied, across the world women display a little more trust – but it’s a smaller differential than that linked to educational attainment.
Several people expressed surprise at greater educational attainment correlating with greater trust in media – surely those better educated are more likely to be cynical (or more kindly, ‘critical’)? Claire Parry pointed out that more educated people are also statistically more likely to work in the media (or know someone who does).
But someone else suggested that the paradox is resolved if we consider that more educated people may tend more firmly to discriminate between particular publications, broadcasters and online news sources, and follow ones they trust while ignoring others. If such a person is asked, ‘how much do you trust newspapers’ and they interpret that question as ‘how much do you trust the newspapers that you yourself read’, they are more likely to answer positively. How questions are understood and reacted to by different people is, of course, a major vulnerability of survey methodologies.
This leads on to an issue which David Penfold raised, and which has been on my mind too. Is there validity in asking people how much they trust a whole category of media, when there are such huge discrepancies in quality of trustworthiness within each category?
I would certainly not be able to answer this survey. If you ask me about trusting print media, I would come back with ‘Do you mean like The Guardian or like The Daily Express or The Daily Mail? Do you mean like Scientific American or The National Enquirer?’ To lump them together and ask me to judge the trustability of a whole category feels absurd to me. Likewise, there are online information sources which I find very trustworthy, while others are execrable. Even on Facebook, I have ‘online-only friends’ who reliably point me towards science-backed information, and I have grown to trust them, while others are entertaining but purvey a lot of nonsense.
Hanna remarked that the whole project is crying out for qualitative research, to which Ainsley added ‘If someone will pay for it!’ Traditional forms of qualitative research (interviews, focus groups) are indeed expensive, but perhaps the micronarrative-plus-signifiers approach embodied in SenseMaker methodology could be tackle these questions. This can scale to find patterns in vast arrays of input, cost-effectively, and can be deployed to track ongoing trends over time. (We got a taste of how that works from Tony Quinlan at the March 2018 NetIKX meeting).
A further caveat was put forward by by David Penfold: just because a source of news and opinion is trusted, it doesn’t mean it’s right. A lot of people trusted The Daily Mail in the 1930s, when it was preaching support for Hitler and promoting anti-semitic views.
Dave Clarke thought that the survey insights were valuable; it was good to see so much quantitative data. He offered to connect the Ipsos MORI team with people he has been working with in the ‘Post-Truth’ area (of which we would hear more later that afternoon).
Martin Fowkes wondered about comparisons between very different countries and media environments. In the UK we can sample a wide spectrum of political news, but in some countries the public is fed a line supporting the leadership’s political agenda. In such conditions, if you ask these poll questions, people may ‘game and gift’ their responses, playing safe. Hanna acknowledged that problem, and suggested that each separate country could be a study in itself.
Aynsley and Hanna agreed with Dion Lindsay that this project was in the nature of a loss-leader, which might help their market to show more interest in funding further research. Also, it is important to Ipsos MORI to be able to demonstrate thought leadership to its client base through such work.
Brennan Jacoby on the philosophical basis of trust
Dr Brennan Jacoby FRSA is the founder and principal of the consultancy Philosophy at Work
Aynsley then introduced Dr Brennan Jacoby, whom he first saw speaking about trust at the Henley Business Centre. A philosopher by trade, Brennan would unpick what trust actually might mean.
Brennan explained that his own investigations into the concept of trust started while he was doing his doctoral work on betrayal (resulting in ‘Trust and Betrayal: a conceptual analysis’, Macquarie University 2011. Much discussion in the literature about trust contrasts trust with betrayal, but fails to define the ‘trust’ concept in the first place. In 2008, Brennan started his consulting practice ‘Philosophy at Work’. Trust was the initial focus, and remains a strong element of his work with organisations.
Brennan asked each of us to think of a brand we consider trustworthy – it could be a media brand, but not necessarily. We came up with quite a variety! – cBeebies, NHS, Nikon, John Lewis…
He told us that one time when he tried this exercise, someone shouted ‘RyanAir!’ She then explained that all RyanAir promise to do is to get you from A to B as cheaply as possible – and that they do. It seems a telling example, illustrating a breadth of interpretations around what it means to be trustworthy (is it just predictability, or is it something more?)
Critiquing the Trust Barometer
Edelman is an American public relations firm. Over the last 18 years it has published an annual ‘Trust Barometer’ report (see the current one at https://www.edelman.com/trust-barometer), which claims to measure trust around the world in government, NGOs, business, media and leaders.
(Conrad notes: there is some irony, in that Edelman has in the past acted to deflect antitrust action against Microsoft, created a fake front group of ‘citizens’ to improve WalMart’s reputation, and worked to deflect public disapproval of News Corporation’s phone hacking, oil company pollution and the Keystone XL pipeline project, amongst others.)
In the Trust Barometer 2018 report, they chose to separate ‘journalism’ from ‘media outlets’ for the first time, reflecting a growing perception that those information sources which are social platforms, such as Facebook, have been ‘hijacked’ by different causes and viewpoints and have become untrustworthy, while professional journalists may still be considered worthy of trust.
It’s interesting to see how Edelman actually asked their polling question. It went: ‘When looking for general news and information, how much would you trust each type of source for general news and information?’, followed by a list of sources, and a nine-point scale against each. Again, this survey fails to define what trust is. If we think about to the Covey definition cited by Hanna, a respondent might say, ‘Yes I trust journalists [because I think they are competent to deliver the facts]’; another respondent might say, ‘yes, I trust journalists [because I think they have good intentions].’ Someone might also say, ‘Well, I have to trust journalists, because in my country I have no choice.’
A philosophy of trust
The role of philosophy in society, said Brennan, should be to solve problems and be practical. Conceptual work isn’t merely of academic interest, but can make key distinctions which can suggest ways forward. So let’s consider the concepts of trust, trustworthiness, and finally distrust.
The word Trust can connote a spread of meanings. There’s trust in individuals, whom we meet face to face, but also those we will never meet; we may consider trust in organisations, in machinery and artefacts, or in artificial intelligence. This diversity of application may be why many conversations around trust shy away from more specificity. But a lack of specificity leaves us unable to distinguish trust from other things.
Trust may be distinguished from mere reliance. The philosophical literature agrees by and large that trust is a kind of reliance, but not just ‘mere reliance’. As an American, Brennan has no choice but to rely on Donald Trump as President – you might say count on him – given that he (Brennan) doesn’t have access to the same information and power. But Brennan doesn’t trust him. Or suppose at work you need to delegate a responsibility to someone new to the role. You have to rely on the person, but you are not quite sure you can trust them.
Special vulnerability. What distinguishes trust from mere reliance is a special kind of vulnerability. To set the scene for a thought experiment, Brennan told a story about the German philosopher Immanuel Kant (1724–1804). He was known for being obsessive about detail. The story goes that as he took his regular walk around town, the townsfolk would set the time on their clocks by the regularity of his appearance. Imagine that one day Kant sleeps in, and that day the townsfolk don’t know what time it is. They might feel annoyed, but would they feel betrayed by him? Probably not.
But now, suppose there is a town hall meeting where the citizens discuss how to be sure of the time, and Kant says, ‘Well, I take a walk at the same time each day, so you can set your clocks by me!’ But suppose one day he sleeps in or decides not to go for his walk. Now the citizens might feel let down, even betrayed. Because of Kant’s offer at the town meeting, they are not just ‘counting on’ him, they are ‘trusting’ him. They thought they had an understanding with him, which set up their expectations in a way they didn’t have before. They may say, ‘We don’t just expect that Kant will walk by at a regular time – we think he ought to.’ There is a distinction here between a predictive expectation, and what we could call a normative one.
Trust = optimistic acceptance of special vulnerability
So, Brennan suggests, we should think about trust as an acceptance of vulnerability; or more precisely, an optimistic acceptance of a special vulnerability. An ordinary kind of vulnerability might be like being vulnerable to being knocked down while crossing the road, or being caught in a rain-shower. This special vulnerability, which is the indicator of trust, is vulnerability to being betrayed by someone in a way that does us harm. There is a moral aspect to this kind of vulnerability, tied up in agreements and expectations.
Regarding the ‘optimism’ factor – suppose you need to access news from a single source, because you live in a country where the media is controlled by the State. That makes you vulnerable to whether or not you are being told the truth. You may say, ‘Well, it’s my nation’s TV station, I have to count on them.’ But suppose you have travelled to other countries and seen how differently things are arranged abroad, you may not be very optimistic about that reliance.
To sum up: Trust is when we optimistically accept our vulnerability in relying on someone.
Trust is not always a good thing!
Brennan showed a picture of a gang of criminals in New South Wales who had holed up in a house together and stayed hidden from the police, until one went to the police and betrayed the others. Did he do good or bad? Consider whistleblowing, where it can be morally positive, or there is good reason, to be distrustful or ‘treacherous’. Trust, after all, can enable abuses of power. Perhaps we should not be getting too flustered about an alleged ‘crisis of trust’ – perhaps it would not be a bad thing if trust ebbs away somewhat – because to be wary of trusting may be rational and positive.
Brennan notes, people may be thinking ‘Hey, if we are not going to trust anyone or anything, we’re not going to make it out the front door!’ But that’s only true if we think reliance and trust are exactly the same. Separating those concepts allows to get on with our lives, while retaining a healthy level of wariness and scepticism.
Baroness Onora O’Neill speaking about trust and distrust
at a TEDx event at the Houses of Parliament in June 2013.
Brennan recommended reading or listening to Baroness Onora O’Neill, an Emeritus Professor of the University of Cambridge who has written and spoken extensively on political philosophy and ethics, using a constructivist interpretation of the ethics of Kant. O’Neill places great emphasis on the importance of trust, consent, and respect for autonomy in a just society. Brennan told us that she gave a TED talk some years ago (2013), in which she argued that we should aim for appropriately placed trust (and appropriately placed distrust).
See talk video at ted.com…
Trustworthiness
When trust is appropriately placed, usually it is because it is placed in someone who is (or at least, is perceived to be) ‘trustworthy’. So what does that mean?Three things are important for trustworthiness, said Brennan; they relate quite well to Stephen MR Covey’s two points.
Competence — As the Australian moral philosopher Dr Karen Jones puts it, ‘the incompetent deserve our trust almost as little as the malicious.’ But in the sphere of media, a further distinction is useful – between technical competence and practical competence. Technical competence is the ability to do the thing that someone is counting on us for – so, will Facebook not give our details to a third party? If we expect them to prevent that, and they know that, are they competent to do so? Practical competence is, further, the ability to track the remit, to be on the same page as what one is being counted on to do.
Suppose you are away travelling, and you ask someone to look after your house while you are away. You may feel confident that they are technically competent to check on security, feed the cat, etc. You probably don’t think you need to leave a note saying ‘Please don’t paint the bathroom.’ You take it for granted that they know what it means to be a house-sitter. If you come back and find the whole place redecorated, even if you love the result, you’re not going to ask them to house-sit again.
This analogy and analysis is important in Facebook’s situation, because there has been a disconnect about what the parties are expecting. It would seem Facebook saw their relationship with us to be different from what we would have assumed. Perhaps the solution is to have a more explicit conversation about expectations.
Dion asked if these conditions of competence are not more to do with reliability than trust, and Brennan agreed. They are the preconditions for trustworthiness, but they are not sufficient.
Integrity of character — this is where the full definition of trustworthiness comes in. Reliability is all one may hope for from an animal, or a machine. Trust further involves the acceptance of a moral responsibility and commitment. Linking back to previous discussion, Brennan said that trust is a relationship that can be had only between members of ‘the moral community’. Reliability is what we expect from an autonomous vehicle; trust is what we might extend to its programmers. And programmers may be deemed to be trustworthy (or not), because they can have Character.
So if we have a media source competent at its job, and committed to doing it, we can so far only rely on them to do what we think they will always do. That is not enough to elicit trust. Assessing trustworthiness involves assessment of moral values, and integrity of character.
How do we assess ‘good character’? Many people are likely to ascribe that value to people like themselves, with whom they share an understanding of the right thing to do. We expect others to do certain things, but adding the factor of obligation clarifies things. For example, we might predict that hospitals will keep missing care targets; but additionally we expect that hospitals ought to care and not kill: this is the constitutive expectation which governs the relationship between users and services.
Brennan noted something unusual (and valuable) about how Mark Zuckerberg apologised after the recent Cambridge Analytica scandal. When most companies screw up, they apologise in a manner that responds to predictive expectations (‘we promise not to miss-sell loans again’, ‘we will never again use flammable cladding on residential buildings’). Zuckerberg’s apology said – ‘Look, sorry, we were wrong – we did the wrong thing.’ That’s valuable in building trust (if you believe him, of course): he was addressing the normative expectations. The anger that feeds the growth of distrust is driven by a sense of moral hurt – what I thought ought to have happened, didn’t.
Distrust
In his final segment, Brennan analysed the concept of distrust as involving scepticism, checking up, and ‘hard feelings’.
Showing images of President Trump and Matt Hancock (UK Secretary of State for Digital, Culture, Media and Sport) Brennan remarked: you may be sceptical about what Trump says he will do or did do; you might check up on evidence of promises and actions; you may have feelings of resentment too. As for Hancock (who also has various demerits to his reputation) – well, said Brennan, he doesn’t trust either of these men, but that doesn’t mean he distrusts both of them. He actively distrusts Trump because of his experience of the man; until recently he didn’t even know Hancock existed, so the animosity isn’t there. There’s an absence of trust, but also an absence of distrust: it’s not binary, there’s a space in the middle.
That could be significant when we talk about trusting the media, and building trust in this space. If we are going to survey or study the degree to which people trust the media, we must be careful to ensure that the questions we put to people correctly distinguish between distrust and an absence of trust; and perhaps distinguish also between mere reliance and true trust.
Perhaps in moving things forward, it may be too ambitious, or even misguided, to aim for an increase in trust? Perhaps the thing to aim for in our media and information sources is Reliability, because that is something we can check up on (e.g. fact-checking), regardless of subjective feelings of trust, distrust, or an absence of trust.
Q&A for Brennan
Bill Thompson (BBC) noted that a Microsoft researcher, danah boyd, who examined the social lives of networked teens, talks about the ‘promise’ that is made: that is, a social media network offers you a particular experience with them, and if you feel that promise has been betrayed, distrust arises. Matt Hancock had not offered Brennan anything yet… The question then is, what is the promise we would like the media to make to us, on which we could base a relationship of trust?
Brennan agreed. Do we know what expectations we have of the media? Have we tried to communicate that expectation? Have the media tried to find out? Bill replied, media owners and bosses can get very defensive very quickly, and journalists will complain that people don’t understand how tough their jobs are. But that’s no way to have a conversation!
Naomi Lees wondered about trust in the context of the inquiry into the June 2017 fire disaster at Grenfell Tower (the inquiry was about to start on a date shortly after this meeting). There is much expectation that important truths will and should be revealed. She thought that was an advance compared to the inquiry into the Hillsborough disaster, where there was a great deal of misinformation and police cover-up, and it took years for the truth to come out.
Conrad Taylor on ‘A Matter of Fact’
After a brief refreshment break, the seminar entered its second part, with a focus not so much on trust and trustworthiness, more on the integrity and truthfulness of news and factual information – both in the so-called ‘grown up media’ of print journalism and broadcasting, and the newer phenomena of web sites and social media platforms.
To open up this half of the topic, I had put together a set of slides, which has been converted to an enhanced PDF with extended page comments. It also has an appendix of 13 pages, with 80 annotated live links to relevant organisations, articles and other resources online.
I was eager to leave 50 minutes for the table-groups exercise I had devised, so my own spoken presentation had to be rushed in fifteen minutes. Because a reader can pretty much make sense of much of my presentation by downloading the prepared PDF and reading the page comments, I shall just summarise my talk briefly below.
Please download the PDF resource file; it may be freely distributed
A matter of fact, or a matter of opinion?
I started with a display of claims that have been seen in the media, particularly online. Some (‘Our rulers are shape-shifting reptilians from another planet’) are pretty wild; ‘MMR vaccine has links to autism’ has been comprehensively disproved in the medical literature; but others such as ‘Nuclear energy can never be made safe’ have been made in good faith, and are valid topics for debate.
Following events such as Russia’s annexation of Crimea, the 2016 US Presidential election, the 2017 Brexit referendum, and the war in Syria, more people and organisations have been expressing alarm at the descent into partisanship, propaganda and preposterous claims in both the established and new media. In the UK, this has included knowledge and information management organisations.
CILIP, the Chartered Institute for Library and Information Professionals, took the lead with its ‘Facts Matter’ campaign for information literacy. ISKO UK, at its September 2017 conference, hosted a panel called ‘False Narratives: developing a KO community response to post truth issues.’ (Full audio available; see links in PDF.) Dave Clarke of Synaptica ran a two-day seminar at St George’s House in January 2018 examining ‘Democracy in a Post-Truth Information Age’, and its report is also available; most recently, ISKO UK returned to the topic within a seminar on ‘Knowledge Organization and Ethics’ (again, audio available).
Dodgy news stories are not new. Rather akin to modern partisan disinformation campaigns was Titus Oates’ 1678 claim to have discovered a ‘Popish Plot’ to assassinate King Charles II (a complete fabrication, but it led to the judicial murder of a couple of dozen people).
Beyond ‘fake news’ to a better-analysed taxonomy
Cassie Staines recently argued on the blog of the fact-checking charity Full Fact that we should stop using the label ‘fake news’. She says: ‘The term is too vague to be useful, and has been weaponised by politicians.’ (Chiefly by Donald Trump, who uses it as a label to mobilise his supporters against quality newspapers and broadcasters who say things he doesn’t like). The First Draft resource site for journalists suggests a more nuanced taxonomy spanning satire and parody, misleading use of factual information by omitting or manipulating context, impersonation of genuine news sources, and completely fabricated, malicious content.
The term ‘post-truth’ got added to the Oxford English Dictionary in 2016, defined as ‘relating to or denoting circumstances in which objective facts are less influential in shaping public opinion than appeals to emotion and personal belief.’ If we want a snappy label, perhaps this one is better than ‘fake news’, and Dave Clarke appropriated it for his project the Post Truth Forum (PTF), to which I am also a recruit. PTF has attempted a more detailed two-level typology.
I briefly mentioned conspiracy theories and rumours such as ‘the 9/11 attacks were an inside job’. A 2014 article in the American Journal of Political Science, ‘Conspiracy Theories and the Paranoid Style(s) of Mass Opinion’ rejects the idea that these are unique to ignorant right-wingers, and says that there is more of a link to a ‘willingness to believe in other unseen, intentional forces and an attraction to Manichean narratives.’ (A certain tendency to conspiracy theory can also be found amongst elements on the environmentalist, left-libertarian and anarchist communities – which is not to say that everyone in those communities is a ‘conspiracist’.)
Misleading health information (anti-vaccination rumours, touting ‘alternative’ nutrition-based cancer treatments) is a category that has been characterised as a public health risk. In the case of the rubbish touted by Mike Adams’ site ‘Natural News’, there is a clearly monetised motive to sell dietary supplements.
Transparency and fact checking
Validating news in a ‘post-truth’ world brings up the question of transparency of information sources. It’s hard to check stories in the media against facts, when the facts are being covered up! Governments are past masters at the cover-up, and it is a constant political struggle to bring public service truths and data, policies and true intentions out into the open. Even then, they are subject to being deliberately misrepresented, distorted, spun and very selectively presented by politicians and partisan media. Companies have done the same, examples being Volkswagen, Carillion, Syngenta; and public relations organisations stand ready to take money to help these dodgy activities.
Karen Schriver speaks about the quest for Plain Language and transparency in American public life & business.
(Listen to podcast.)
But even when information is available, it is often not truly accessible to the public – because it may be badly organised, badly worded, badly presented – not through malice, but because of misunderstanding, incompetence and lack of communication skills. This is where information designers, plain language specialists, technical illustrators and data-diagrammers have skills to contribute. I suggest listening to a podcast of an interview with my friend Dr Karen Schriver, who was formerly Professor of Rhetoric and Document Design at Carnegie-Mellon University: she speaks about the Plain Language movement in the USA, and its prospects (again, link in PDF).
When it comes to reality checking, sometimes common sense is a good place to start. I took apart an article in London’s Evening Standard quoting a World-Wide Fund for Nature estimate that the UK uses 42 billion plastic straws annually. Do the maths! That would mean that each one of our 66 million population, from infant child to aged pensioner, on average uses 636 straws a year. Is this credible? BBC Reality Check looked into this, and a very different claim made by DEFRA (8.5 billion/year), and found that both figures came from the consultancy ‘Eunomia’, whose estimating methodologies and maths are open to question.
To be fair to journalists, it is hard for them to check facts too. In my slide deck I list a number of pressures on them. Amongst the most problematic are shrinking newsroom budgets and staffing, time pressures in the 24-hour news cycle, and more information coming in via tweets and social media and YouTube, especially from conflict and disaster zones abroad. There are projects and organisations trying to help journalists (and the public) through this maze; I have already mentioned Full Fact and First Draft, and a new one is DMINR from City University of London School of Journalism.
Group exercise: contested truths, trust in sources
Our seminar participants gathered in table groups of about six or seven. To the tables, I distributed five sheets each bearing a headline, referring to a fairly well-known (mostly UK-centric) current affairs issue, as follows:
Using ‘divide the dollar’ with British pennies to rapidly select two of the topics to discuss.)
‘Divide the dollar’
I asked the teams to use a ‘divide-the-dollar’ game to quickly select two of the presented choices of topics on which their table would concentrate. (Each person took three coins, put two on their personal first choice, and one on their second choice; the group added up the result and adopted the two top scorers).
Tag and talk
I also presented a sheet of ‘tags’ denoting possible truth and comprehension issues which might afflict these narratives, such as ‘State-sponsored trolling’ or ‘hard to understand science’. Table groups were encourage to write tags onto the sheets for their chosen topics – quickly at first, without discussion – and then start deciding which of these factors were dominant in each case.
The final part of the exercise was to think about how we might start ‘fact-checking’ each news topic. Which information sources, or research methods, would you most trust in seeking clarity? Which would you definitely distrust? And finally, though in the time limit we didn’t really get into this, can people identify their own biases and filters, which might impede objective investigation of the issues?
A lively half-hour exercise ensued, with the environmental/pollution topics emerging on most tables as the favourite case studies. Problems getting to grips with the science was identified as a key difficulty in assessing claim and counter-claim about these. I then spent the last ten minutes pulling out some shared observations from the tables.
It was all a bit of a scramble, but NetIKX audiences like their chance to engage actively in small groups (it’s one of the USPs of NetIKX, which we try to do at most meetings), Perhaps it points its way to an exercise which could be repeated, if not in content, then using the same method around a different subject.
My own reflections
Disinformation and ‘fake news’ Interim Report. published by the House of Commons Digital, Culture, Media and Sport Committee in July 2018. The report lambasts the social media platforms, but is eerily silent about disinformation and slanted reporting in Britain’s tabloid press. (Download the report.)
I personally think that being sceptical of all sources of information is healthy, and none can demand our trust until they have earned it. This is true whatever the information channel. In that respect I agree with Brennan Jacoby, and with Baroness O’Neill.
Our seminar had focused primarily on political opinions and news stories, and in this field the control and manipulation of information is a weapon. To cope, on the one hand we need better access to fact-checking resources; on the other we need to understand the political agenda and motivations and pressures on each publisher and broadcaster — and, indeed, commercial or government or NGO entity which is trying to spin us a line.
Amongst librarians there are calls for promoting so-called ‘information literacy’ and critical thinking habits, from an early age. I would add that the related idea of ‘media literacy’ also has merit.
I have a strong interest in the field of science communication. Some of the most pressing problems of our age are best informed by science, including land and agriculture management, the treatment of diseases, climate change risks, future energy policy, and the challenges of healthcare. But here we have a double challenge: on the one hand, most people are ill-equipped to understand and evaluate what scientists say; on the other, powerful commercial and nationalist interests are working to undermine scientific truth and profit from our ignorance.
Two related aspects of science communication we might further look at are understanding risk, and understanding statistics. The information-and-knowledge gang keeps itself artificially apart from those who work with data and mathematics – that too would be a gulf worth bridging.
— Conrad Taylor, May 2018
May 2018 Seminar: Trust and integrity in information
/in Events 2018, Harnessing the web for information and knowledge exchange, Previous Events/by NetikxSummary
The question of how we identify trustworthy sources of information formed the basis of this varied and thought-provoking seminar. Hanna Chalmers, Senior Director of IPSOS Mori, detailed the initial results of a recent poll on trust in the media. Events such as the Cambridge Analytica scandal have resulted in a general sense that trust in the media is in a state of crisis. Hanna suggested that it is more accurate to talk of trust in the media as being in flux, rather than in crisis. Dr Brennan Jacoby from Philosophy at Work, approached the topic of trust from a different angle – what do we mean by trust? The element of vulnerability is what distinguishes trust from mere reliance: when we trust, we risk being betrayed. This resulted in a fascinating discussion with practical audience suggestions.
Speakers
Hanna Chalmers is a media research expert, having worked client side at the BBC and Universal Music before moving agency side with a stint at IPG agency Initiative and joining Ipsos as a senior director in the quality team just under three years ago. Hanna works across a broad range of media and tech clients exploring areas that are often high up the political agenda. Hanna has been looking at trust in media over the last year and is delighted to be showcasing some of the most recent findings of a global survey looking at our relationship with trust and the media around the world.
Dr Brennan Jacoby is the founder of Philosophy at Work. A philosophy PhD, Brennan has spent the last 6 years helping businesses address their most important issues. While he specialises on bringing a thoughtful approach to a range of topics from resilience, communication, innovation and leadership, his PhD analysed trust, and he has written, presented and trained widely on the topic of trustworthiness and how to build trust. Recent organisations he has worked with include: Deloitte, Media Arts Lab and Viacom. Website: https://philosophyatwork.co.uk/dr-brennan-jacoby/
Time and Venue
2pm on 24th May 2018, The British Dental Association, 64 Wimpole Street, London W1G 8YS
Pre Event Information
In this new media age, the flow of information is often much faster than our ability to absorb and criticise it. This poses a whole set of problems for us individually, and in our organisations and social groupings, especially as important decisions with practical consequences are often made on the basis of our possibly ill-informed judgements. There is currently a huge interest in the area of ‘fake news’ and ‘alternative facts’ and other ‘post truth’ information disorders circulating in the traditional and social media, and it is appropriate for us as Knowledge and Information Professionals to be able to operate successfully in this increasingly difficult environment, and provide expertise in information literacy and fact-checking to bring to our workplaces.
Slides
No slides available for this presentation
Tweets
#netikx91
Blog
See our blog report: Trust and Integrity in Information
Study Suggestions
Article on Global Trust in Media: https://digiday.com/media/global-state-trust-media-5-charts/
Working in Complexity – SenseMaker, Decisions and Cynefin
/in Netikx/by NetikxAccount of a NetIKX meeting with Tony Quinlan of Narrate, 7 March 2018, by Conrad Taylor
At this NetIKX afternoon seminar, we got a very thorough introduction to Cynefin, ananalytical framework that helps decision-makers categorise problems surfacing in complex social, political and business environments. We also learned about SenseMaker®, an investigative method with software support, which can gather, manage and visualise patterns in large amounts of social intelligence, in the form of ‘narrative fragments’ with quantitative signifier data attached.
Tony Quinlan explaining how to interpret SenseMaker signifiers. The pink objects behind him are the micro-narratives we produced during the exercise, on ‘super-sticky’ Post-It notes. Photo Conrad Taylor.
The leading architect of these analytical frameworks and methods is Dave Snowden, who in 2002 set up the IBM’s Cynefin Centre for Organisational Complexity and founded the independent consultancy Cognitive Edge in 2005.
Our meeting was addressed by Tony Quinlan, CEO and Chief Storyteller of consultancy Narrate (https://narrate.co.uk/), which has been using Cognitive Edge methodology since 2008. Tony, with his Narrate colleague Meg Odling-Smee, ran some very engaging hands-on exercises for us, which gave us better insight into what SenseMaker is about. Read on!
What follows is, as usual, my personal account of the meeting, with some added background observations of my own. (I have been lucky enough to taken part in three Cognitive Edge workshops, including one in which Tony himself taught us about SenseMaker.)
The power of narrative
Tony Quinlan also used to work for IBM, in internal communications and change management; he then left to practice as an independent consultant. Around 2000, he set up Narrate, because he recognised the valuable information that is held in narratives. Then in 2005, as Dave Snowden was setting up Cognitive Edge, Tony became aware of the Cynefin Framework – a stronger theoretical basis for understanding the significance of narrative, and how one might work effectively with it.
There several ways of working with narratives in organisations, and numerous practitioners. There’s a fruitful workshop technique called ‘Anecdote Circles’, well described in a workbook from the Anecdote consultancy. (See their ‘Ultimate Guide to Anecdote Circles’ in PDF. There is also the ‘Future Backwards’ exercise, which Ron Donaldson demonstrated to NetIKX at a March 2017 meeting. These methods are good, but they require face-to-face engagement in a workshop environment.
A problem arises with narrative enquiry when you want to scale up – to collect and work with lots of narratives – hundreds, thousands, or more. How do you analyse so many narratives without introducing expert bias? Tony found that the SenseMaker approach offered a sound solution and, so far, he’s been involved in about 50 such projects, in 30 countries around the world.
I was reminded by Tony’s next comment of the words of Karl Marx: ‘The philosophers have only interpreted the world, in various ways. The point, however, is to change it.’
Tony remarked that there is quite a body of theory behind the Cognitive Edge worldview, combining narrative-based enquiry with complexity science and cognitive neuroscience insights. But the real reasons behind any SenseMaker enquiry are: ‘How do we make sense of where we are? What do we do next?’ So we were promised a highly practical focus.
A hands-on introduction to SenseMaker
Tony and Meg had prepared an exercise to give us direct experience of what SenseMaker is about, using an arsenal of stationery: markers, flip-chart pages, sticky notes and coloured spots!
Collecting narratives: The first step in a SenseMaker enquiry is to pose an open-ended question, relevant to the enquiry, to which people respond with a ‘micro-narrative’. To give us an exercise example, Tony said: ‘Sit quietly, and think of an occasion which inspired/pleased you, or frustrated you, in your use of IT [support] in your organisation (or for freelances, with an external organisation you contact to get support).’
Extra-large Post-It notes had been distributed to our tables. Following instructions, we each took one, and wrote a brief narrative about the experience we’d remembered. After that, we gave our narrative a title. We were also given sheets of sticky-backed, coloured dots. We took seven each, all of the same colour, and wrote our initials on them. We each took one of our dots, and stuck it on our own narrative sticky note. Then, we all came forward and attached our notes to the wall of the room.
Adding signifiers: Tony now drew our attention to where he and Meg had stuck up four posters. On three, large triangles were drawn, each with a single question, and labels at the triangle corners. The fourth was drawn with three stripes, each forming a spectrum. (This description makes better sense if you look at our accompanying diagrams.) In SenseMaker practice these are called ‘triads’ and ‘dyads’ respectively, and they are both kinds of SenseMaker ‘signifiers’.
For example, the first triad asked us: ‘In the story you have written, indicate which needs were being addressed’. The three corners were labelled ‘Business needs’, ‘Technology needs’ and ‘People’s needs’. We were asked each to take one of our initialled, sticky dots and place it within the triangle, based on how strongly we felt each element was present within our story.
As for the dyads, we were to place our dot at a position along a spectrum between opposing extremes. For example, one prompted: ‘People in this example were…?’ with one end of the spectrum labelled ‘too bureaucratic’ and the other ‘too risky’.
In the diagrams below I have represented how our group’s total results plotted out over the triads and dyads, but I have made all the dots the same colour (for equal visual weight); and, obviously, there are no identifying initials.
Figure 1 Triad set
Figure 2 Dyad compilation
A few observations on the exercise
Our exercise gathered retrospective narratives, collected in one afternoon. But SenseMaker can be set up as an ongoing exercise, with each narrative fragment and its accompanying signifiers time-stamped. So, we can ask questions like ‘were customers more satisfied in May than in April or March?’
Analysing the results
Calling us to order, Tony talked through our results. At first, he didn’t even look at our narratives on the wall. It’s hard to assess lots of narratives without getting lost in the detail. It’s still more difficult if you have to wade through megabytes of digital audio recordings – another way some narratives have been collected in recent years.
But the signifiers can be thrown up en masse on a computer screen in a visual array, as they were on our posters. Then it’s easy to spot significant clusterings and outliers, and you can drill down to sample the narratives with a single click on a dot. Even with our small sample we could see patterns coming up. One dyad showed that most people thought the IT department was to blame for problems.
With SenseMaker software support, this can scale. Tony recalled a project in Delhi with 1,500 customers of mobile telecoms, about what helped and what didn’t when they needed support. A recent study in Jordan, about how Syrian refugees can be better supported, gathered 4,000 responses.
This was an enlightening exercise, giving NetIKX participants a glimpse of how SenseMaker works. But just a glimpse, cautioned Tony: the training course is typically three days.
Why do we do it like this?
Now it was time for some theory, including cognitive science, to explain the thinking behind SenseMaker.
How do humans make decisions? Not as rationally as we might like to believe, and not just because emotions get in the way. As humans we evolved to be pattern-matching intelligences. We scan information available to us, typically picking up just a tiny bit of what is available to us, and quickly match it against pre-stored response patterns. (And, as Dave Snowden has remarked, any of our hominid ancestors who spent too long pondering the characteristics of the leopard bounding towards them didn’t get to contribute to the gene pool!)
‘But there’s worse news,’ said Tony. ‘We don’t go for the best pattern match; we go for the first one. Then we are into confirmation bias, which is difficult to snap out of.’ (Ironically for knowledge management practice, maybe that means ‘lessons learned’ thinking can set us up for a fall – blocking us from seeing emerging new phenomena.)
Patterns of thinking are influenced by the cultures in which we are embedded, and the narratives we have heard all our lives. Those cultures and stories may be in the general social environment, or in our subcultures (e.g. religious, political, ethnic); they could be formed in the organisation in which we work; they could come at us from the media. All these influences shape what information we take in, and what we filter out; and how we respond and make decisions.
Examining people’s micro-narratives shows us the stories that people tell about their world, which shape opinions and decisions and behaviour. In SenseMaker, unlike in polls and questionnaires, we gather the stories that come to people’s minds when asked a much more open-ended prompting question. SenseMaker questions are deliberately designed to be oblique, without a ‘right answer’, thus hard to gift or game.
You don’t necessarily get clean data by asking straight questions, because there’s that strong human propensity to gift or to game – to give people the answer we think they want to hear, or to be awkward and say something to wind them up. In the Indian project with mobile service customers, when poll questions asked customers they would recommend the service to others, the responses were overwhelmingly positive. But in the SenseMaker part of the research, about 20% of those who claimed they would definitely recommend the company’s service, were shown by the triads to really think the diametric opposite.
Social research methods that do use straight questions are not without value, but they are reaching the limits of what they can do, and are often used in places where they no longer fit: where dynamics are complex, fluid and unpredictable. But complexity is not universal, said Tony; it is one domain amongst a number identified in the Cynefin Framework.
The Cynefin Framework
Figure 3 Diagram of the Cynefin domains, with annotations
Cynefin, explained Tony, is a Welsh word (Dave Snowden is Welsh). It means approximately ‘The place(s) where I belong.’ Cynefin is a way of making sense of the world: of human organisation primarily. It is represented by a diagram, shown in Fig. 3, and lays out a field of five ‘domains’:
Finally, Tony pointed out a feature on the borderlands between Obvious and Chaotic, typically drawn like a cliff or fold. This is there to remind us that if people act with complete blind conviction that things are really simple and obvious, and Best Practice is followed without question, the organisation can be blindsided to major changes happening in their world. One day, when you pull the levers, you don’t get the response you have come to expect, and you have a crisis on your hands. And if you simply try to re-impose the rules, it can make things worse.
But with chaos may come opportunity. Once you have a measure of control back, you have a chance to be creative and try something new. And as we prepared to take a refreshment break, Tony urged us, ‘Don’t let a good crisis go to waste!’
Working in complex adaptive systems
Tony recalled that his MBA course was predicated on the idea that things are complicated, but there is a system for working things out. The corollary: if things don’t work out, either you didn’t plan well or you failed in implementation (‘are you lazy or stupid?’) Later, when he saw the Cynefin model, he was relieved to note that you can be neither lazy nor stupid and things can still go pear-shaped, in a situation of complexity.
In Cognitive Edge based practice, when you find you are operating in the domain of complexity, the recommendation is to initiate ‘safe-to-fail’ probes and experiments. Here are some working principles:
When monitoring, it’s better to ask people what they do, rather than what they think. You’d be surprised how many respondents claim to a think a certain way, but that isn’t what they actually do or choose.
Even with the micro-narrative approach, you have to be careful in your evaluation. Meaning is not only in the words, and responses may be metaphorical, or even ironic. That can be tricky if you are working across cultures.
Safe-to-fail in Broken Hill: My personal favourite Snowden anecdote illustrating ‘safe-to-fail’ experiments comes from work Dave did with Meals on Wheels and the Aboriginal communities around Broken Hill, NSW, Australia. How could that community’s diets be improved to avoid Type II diabetes?
Projects were proposed by community members. 13 were judged ‘coherent’ enough to be given up to Aus$ 6,000 each: bussing elders to eat meals in common; sending troublesome youngsters to the bush to learn how to hunt; farming desert pears; farming wild yabbies (crayfish; see picture).
Results? Some flopped (bussing elders); some merged (farming desert pears and yabbies); some turned out to work synergistically (hunting lessons for youth generated a meat surplus to supply a restaurant, using traditional killing and cooking practices). Nothing failed catastrophically.
The crucial role of signifiers
In a SenseMaker enquiry, only the respondents can say what their stories mean; interacting with well designed signifiers is very powerful in this regard. Tony recalled one project with young Ethiopian women; their narratives were presented to UNDP gender experts, who were asked to read them and fill out the SenseMaker signifiers as they thought the young women might. The experts’ ideas are not unimportant; but, they significantly differed from the responses ‘from the ground’, which can be important in policymaking. SenseMaker de-privileges the expert and clarifies the voice of the respondent. Dave Snowden refers to this as ‘disintermediation’.
When you design a SenseMaker framework, you do it in such a way that it doesn’t suggest a ‘right’ answer. As an example of the latter, Tony showed a linear scale asking about a conference speaker’s presentation skills, ranging from ‘poor’ to ‘excellent’ (and looking embarrassingly like the NetIKX evaluation sheets!). ‘If I put this up, you know what answer I’m looking for.’
In contrast, he showed a triad version prepared in the course of work with a high street bank. The overall prompt asked ‘This speaker’s strengths were…’ and the three corners of the triad were marked [a] relevant information; [b] clear message; [c] good presentation skills. Tony took a sheaf of about a hundred sheets evaluating speakers at an event, and collated the ‘dots’ onto master diagrams. One speaker had provoked a big cluster of dots in the ‘relevant information’ corner. Well, relevance is good – but evidently, his talk had been unclear, and his presentation skills poor.
Tony showed a triad that was used in a SenseMaker project in Egypt. The question was, ‘What type of justice is shown in your story?’ and the corners were marked [a] revenge, getting your own back; [b] restorative, reconciling justice; and [c] deterrence, to warn others from acting as the perpetrator had done.
Tony then showed a result from a similar project in Libya, which collected about 2,000 micro-narratives. The dominant form of justice? Revenge. This was cross-correlated with responses about whether the respondents felt positively or negatively about their story, and the SenseMaker software displayed that by colouring the dots on a spectrum, green to red. And what this showed was, people felt good in that culture and context about revenge being the basis of justice.
In SenseMaker evaluation software (‘Explorer’, see end), if you want to make even more sense, you click on a dot and up comes the text of the related micro-narrative. Or, you can ask to see a range of stories in which the form of justice people felt good about was of the deterrent type. In this case, those criteria pulled up a subset of 171 stories, which the project team could then page through.
From analysis to action: another exercise
SenseMaker wasn’t created for passive social research projects. It is action-oriented. An important question used in a lot of Cognitive Edge projects is, ‘What can we do to have fewer stories like that, and more stories like this?’ That question is a useful way to encourage people to think about designing interventions, without flying away into layers of abstraction. You get stakeholders together, show them the patterns, and ask, ‘What does this mean?’ Using as a guide the idea of ‘more stories like these, fewer like those,’ you then collectively design interventions to work towards that.
Tony had more practical exercises for us, to help us to understand this analytical and intervention-designing process.
Here is the background: about five years ago, a big government organisation was worried about how its staff perceived its IT department. Tony conducted a SenseMaker exercise with about 500 participants, like the one we had done earlier – the same overall question to provoke micro-narratives, and the same or similar triad and dyad signifier questions.
Now we were divided into five table groups. Each group was given sheets of paper with labelled but blank triads on them. We were each of us to think about where on the triad we would expect most answers to have come, then make a mark on the corresponding triad. Then Tony showed us where the results actually did come in.
I’m not going into detail about how this exercise went, but it was interesting to compare our expectations as outsiders, with the actual historical results. This ‘guessing game’ is also useful to do with the stakeholder community in a real SenseMaker deployment, because it raises awareness of the divergence between perceptions and reality.
Ideas can come from the narratives
In SenseMaker, micro-narratives are qualitative data; the signifier responses, which resolve into dimensional co-ordinates, are in numerical form, which can be be more easily computed, pattern-matched, compared and visualised with the aid of machines. This assists human cognition to home in on where salient issue clusters are. Even an outsider without direct experience of the language or culture can see those patterns emerging on the chart plots.
But when it comes to inventing constructive interventions, it pays to dip down into the micro-narratives themselves, where language and culture are very important.
In a project in Bangladesh, the authorities and development agency partners had spent years trying to figure out how to encourage rural families to install latrines in their homes, instead of the prevailing behaviour of ‘open defecation’ in the fields. Tony’s initial consultations were with local experts, who said they would typically focus on one of three kinds of message. First, using family latrines improves public health, avoiding water-borne diseases and parasites. Second, it reduces risk (e.g. avoiding sexual molestation of women). Third, it reduces the disgust factor. Which of those messages would be most effective in making a house latrine a desirable thing to have?
A SenseMaker enquiry was devised, and 500 responses collected. But when the signifier patterns were reviewed, no real magic lights came on. Yes, one of the triads which asked ‘in your story, a hygienic latrine was seen as [a] healthy [b] affordable [c] desirable’ returned a strong pattern answers indicating ‘healthy’. But that could be put down to years of health campaigns – which had nevertheless not persuaded people to install latrines.
Get a latrine, have a happy marriage! But behind every dot is a story. The team in the UK asked the team in Dhaka to translate a cluster of some 19 stories from Bengali and send them over. There they found a bunch of stories which conveyed this message: if you install a latrine, you’ve got a better chance of a good marriage! One such story told of a young man, newly married, who got an ear-wigging from his mother-in-law, who told him in no uncertain terms what a low-life he was for not having a latrine in the house for her wonderful daughter…
Another story was from a village where there were many girls of marriageable age. Their families were receiving proposals from nearby villages. A young man came with his family to negotiate for a bride, and after a meal and some conversation, a guest asked to use the toilet. The girl’s father simply indicated some bushes where the family did their business. Immediately, the negotiations were broken off. The young man’s family declared that they could not establish a relationship with a family which did not have a latrine. Before long, the whole village knew why the marriage had been cancelled – and why! Shamed and chastened, the girl’s family did invest in a latrine, and the girl eventually found a husband.
As an outcome of this project, field officers have been equipped with about twenty memorable short stories, along similar lines about the positive social effect of having a latrine, and this is having an effect. If the narratives had not been mined as a resource, this would not have happened.
SenseMaker meets Cynefin
As our final exercise, Tony distributed some of the micro-narratives contributed to the project at that government organisation five years ago. We should identify issues illustrated by the narratives, and for each one we discovered, we should write a summary label on a sticky-backed note.
He placed on the wall a large poster of the Cynefin Framework diagram, and invited us to bring our notes forward, and stick them on the diagram to indicate whether we thought that problem was in the Complex domain, or Complicated, or Obvious or Chaotic, or along one of the borders… That determines whether you think there is an obvious answer, or something where experts need to consulted, or if we are in the domain of Complexity and it’s most appropriate to devise those safe-to-fail experimental interventions.
We just took five minutes over this exercise; but Tony explained, he has presided over three-hour versions of this. For the government department, he had this exercise done by groups constituted by job function: directors round one table, IT users round another, and so on. All had the same selection of micro-narratives to consider; each group interpreted them according to their shared mind-set. For the directors, just about everything was Obvious or Complicated, soluble by technical means and done by technologists. The system users considered a lot more problems to be in the Complex space, where solutions would involve improving human relations.
On that occasion, table teams were then reformulated to have a diverse mix of people, and the rearranged groups thought up direct actions that could solve the simple problems, research which could be commissioned to help solve complicated problems, and as many as forty safe-to-fail experiments to try out on complex problems. The whole exercise was complete within one day. Many of the practical suggestions which came ‘from the ground up’ were not that expensive or difficult to implement, either.
SenseMaker: some technical and commercial detail
Tony did not have time to go into the ‘nuts and bolts’ of SenseMaker, so I have done some online study to be able to tell our readers more, and give some links.
We had experienced a small exercise with the SenseMaker approach, but the real value of the methods come when deployed on a large scale, either one-off or continuously. Such SenseMaker deployments are supported by a suite of software packages and a database back end, maintained by Cognitive Edge (CE). Normally an organisation wanting to use SenseMaker would go through an accredited CE practitioner consultancy (such as Narrate), which can select the package needed, help set it up, and guide the client all the way through the process to a satisfactory outcome, including helping the client group to design appropriate interventions (which software cannot do).
SenseMaker® Collector After initial consultations with the client and the development of a signification framework, an online data entry platform called Collector is created and assigned a specific URL. Where all contributors have Internet access, for example an in-company deployment, they can directly add their stories and signifier data into an interface at that URL. Where collection is paper-based, the results will have to be manually entered later by project administrators with Internet access.
A particularly exciting recent trend in Collector is its implementation on mobile smart devices such as Apple iPad, with its multimedia capabilities. Narrative fragment capture can now be done as an audio recording with communities who cannot read or write fluently, so long as someone runs the interview and guides the signification process.
My favourite case study is one that Tony was involved in, a study in Rwanda of girls’ experience commissioned by the GirlHub project of the Nike Foundation. A cadre of local female students very quickly learned how to use tablet apps to administer the surveys; the micro-narratives were captured in audio form, stored on the device, and later uploaded to the Collector site when an Internet connection was available.
Using iPads for SenseMaker collecting: The SenseMaker Collector app for iOS was first trialled in Rwanda in 2013. Read Tony’s blog post describing how well it worked. The project as a whole was written up in 2014 by the Overseas Development Institute (‘4,000 Voices: Stories of Rwandan Girls’ Adolescence’) and the 169-page publication is available as a 10.7 MB PDF.
SenseMaker® Explorer Once all story data has been captured, SenseMaker Explorer software provides a suite of tools for data analysis. These allow for easy visual representation of data, amongst the simplest being the distribution of data points across a single triad to identify clusters and outliers (very similar to what we did with our poster exercise earlier). By drawing on multiple signifier datasets and cross-correlating them, Explorer can also produce more sophisticated data displays, for example a kind of 3D display which Dave Snowdon calls a ‘fitness landscape’ (a term probably based on a computation method used in evolutionary biology – see Wikipedia, ‘Fitness landscape’, for examples of such graphs). Explorer can also export data for analysis in other statistical packages.
A useful page to visit for an overview of the SenseMaker Suite of software is http://cognitive-edge.com/sensemaker/ — it features a short video in which Dave Snowden introduces how SenseMaker works, against a series of background images of the software screens, including on mobiles.
That page also gives links to eleven case studies, and further information about ‘SCAN’ deployments. SCANs are preconfigured, standardised SenseMaker packages around recurrent issues (example: safety), which help an organisation to implement a SenseMaker enquiry faster and more cheaply than if a custom tailored deployment is used.
Contacting Narrate
Tony and Meg have indicated that they are very happy to discuss SenseMaker deployments in more detail, and Tony has given us these contact details:
Tony Quinlan, Chief Storyteller
email:
mobile: +44 (0) 7946 094 069
Website: https://narrate.co.uk/
First Meeting Outside London: Organising Medical and Health-related Information – Leeds – 7 June 2018
/in Netikx/by NetikxWe have now planned our first meeting outside London. This will be in Leeds on Thursday 7 June and the topic will be Medical Information. The meeting will be a joint one with ISKO UK. Speakers will include Ewan Davis.
There will be no charge for attending this meeting, but you must register. For more information and to register, follow the link above.
March 2018 Seminar: Working in Complexity – SenseMaker, Decisions and Cynefin
/in Developing and exploiting information and knowledge, Events 2018, Previous Events/by NetikxSummary
At this meeting attendees were given the opportunity to take part in experimenting with a number of tools and analytical approaches that have been used to good effect in dealing with intractable, complex problems. It was a lively action-packed meeting with useful learning for Monday morning, and plenty of opportunity for networking and exchanging ideas and experience across organisations.
Speaker
Tony Quinlan is an independent consultant and a member of the Cognitive Edge network of practitioners founded by Dave Snowden in 2004. As a co-trainer with Dave, Tony has worked internationally, teaching techniques for addressing complexity to a variety of organisations.
Tony has used SenseMaker® in over 50 projects in the past decade, including in Europe, Asia, Africa and Latin America. He has helped organisations such as the European Commission, United Nations Development Programme and various UK government departments work with the Cynefin framework since 2005. This mix gives him a unique combination of theoretical foundations and practical field experience.
Tony blogs at https://narrate.co.uk/news/
Time and Location
2pm on 7th March 2018, The British Dental Association, 64 Wimpole Street, London W1G 8YS
Pre Event Information
In complex, uncertain and dynamically changing situations, there is a need for good, context-heavy and up-to-date information which decision-makers can access fast. The traditional approaches – such as questionnaires, citizen polling, employment engagement surveys and patient focus groups – have all had limited success in meeting that need, and they are failing to support decision- makers with appropriate strategies to deal with the inherent uncertainty of complexity.
This NetIKX seminar session will give attendees the opportunity take part in experimenting with a number of tools and analytical approaches that have been used to good effect in dealing with intractable, complex problems. In particular we will look at:
The afternoon will be interactive from the beginning – including an ‘acoustic SenseMaker®’ exercise, along with examples from various organisations; an explanation of the underlying principles; and how to make best use of these methods to intervene in evolving situations and to obtain desirable outcomes.
Time allowing, the afternoon will also include discussion and exercises around how this approach can be combined with the Cynefin framework to improve organisational resilience and decision-making. A pdf giving detail of the meeting is available at Working in Complexity
Slides
No slides available for this presentation
Tweets
#netikx90
Blog
See our blog report: Working in Complexity.
Study resources
Tony Quinlan suggests this website: https://narrate.co.uk/
Making true connections in a complex world – Graph database technology and Linked Open Data – 25th January 2018
/in Harnessing the web for information and knowledge exchange, Managing information and knowledge, Netikx/by NetikxConrad Taylor writes:
The first NetIKX meeting of 2018, on 25 January, looked at new technologies and approaches to managing data and information, escaping the limitations of flat-file and relational databases. Dion Lindsay introduced the concepts behind ‘graph databases’, and David Clarke illustrated the benefits of the Linked Data approach with case studies, where the power of a graph database had been enhanced by linking to publicly available resources. The two presentations were followed by a lively discussion, which I also report here.
The New Graph Technology of Information – Dion Lindsay
Flat-file and relational database models
In the last 40 years, the management of data with computers has been dominated by the Relational Database model devised in 1970 by Edgar F Codd, an IBM employee at their San José Research Center.
FLAT FILE DATABASES. Until then (and also for some time after), the model for storing data in a computer system was the ‘Flat File Database’ — analogous to a spreadsheet with many rows and columns. Dion presented a made-up example in which each record was a row, with the attributes or values being stored in fields, which were separated by a delimiter character (he used the | sign, which is #124 in most text encoding systems such as ASCII).
Example: Lname, Fname, Age, Salary|Smith, John, 35, £280|
Doe, Jane 28, £325|Lindsay, Dion, 58, £350…
In older flat-file systems, each individual record was typically input via a manually-prepared 80-column punched card, and the ingested data was ‘tabulated’ (made into a table); but there were no explicit relationships between the separate records. The data would then be stored on magnetic tape drives, and searching through those for a specific record was a slow process.
To search such a database with any degree of speed required loading the whole assembled table into RAM, then scanning sequentially for records that matched the terms of the query; but in those early days the limited size of RAM memory meant that doing anything clever with really large databases was not possible. They were, however, effective for sequential data processing applications, such as payroll, or issuing utility bills.
The IBM 2311 (debut 1964) was
an early hard drive unit with 7.25 MB storage. (Photo from Wikimedia Commons user
‘I, Deep Silence’
[Details])
HARD DISKS and RELATIONAL DATABASES. Implementing Codd’s relational database management model (RDBM) was made possible by a fast-access technology for indexed file storage, the hard disk drive, which we might call ‘pseudo-RAM’. Hard drives had been around since the late fifties (the first was a component of the IBM RAMAC mainframe, storing 3.75 MB on nearly a ton of hardware), but it always takes time for the paradigm to shift…
By 1970, mainframe computers were routinely being equipped with hard disk packs of around 100 MB (example: IBM 3330). In 1979 Oracle beat IBM to market with the first Relational Database Management System (RDBMS). Oracle still has nearly half the global market share, with competition from IBM’s DB2, Microsoft SQL Server, and a variety of open source products such as MySQL and PostgreSQL.
As Dion pointed out, it was now possible to access, retrieve and process records from a huge enterprise-level database without having to read the whole thing into RAM or even know where it was stored on the disk; the RDBMS software and the look-up tables did the job of grabbing the relevant entities from all of the tables in the system.
TABLES, ATTRIBUTES, KEYS: In Codd’s relational model, which all these RDBMS applications follow, data is stored in multiple tables, each representing a list of instances of an ‘entity type’. For example, ‘customer’ is an entity type and ‘Jane Smith’ is an instance of that; ‘product’ is an entity type and ‘litre bottle of semi-skimmed milk’ is an instance of that. In a table of customer-entities, each row will represents a different customer, and columns may associate that customer with attributes such as her address or loyalty-card number.
One of the attribute columns is used as the Primary Key to quickly access that row of the table; in a classroom, the child’s name could be used as a ‘natural’ primary key, but most often a unique and never re-used or altered artificial numerical ID code is generated (which gets around the problem of having two Jane Smiths).
Possible/permitted relationships can then be stated between all the different entity types; a list of ‘Transactions’ brings a ‘Customer’ into relationship with a particular ‘Product’, which has an ‘EAN’ code retrieved at the point of sale by scanning the barcode, and this retrieves the ‘Price’. The RDBMS can create temporary and supplementary tables to mediate these relationships efficiently.
Limitations of RDBMs, benefits of graphs
However, there are some kinds of data which RDBMSs are not good at representing, said Dion. And many of these are the sorts of thing that currently interest those who want to make good use of the ‘big data’ in their organisations. Dion noted:
Suppose, said Dion, we take the example of money transfers between companies. Company A transfers a sum of money to Company B on a particular date; Company B later transfers parts of that money to other companies on a variety of dates. And later, Company A may transfer monies to all these entities, and some of them may later transfer funds in the other direction… (or to somewhere in the British Virgin Islands?)
Graph databases represent these dynamics with circles for entities and lines between them, to represent connections between the entities. Sometimes the lines are drawn with arrows to indicate directionality, sometimes there is none. (This use of the word ‘graph’ is not be confused with the diagrams we drew at school with x and y axes, e.g. to represent value changes over time.)
This money-transfer example goes some way towards describing why companies have been prepared to spend money on graph data technologies since about 2006 – it’s about money laundering and compliance with (or evasion of?) regulation. And it is easier to represent and explore such transfers and flows in graph technology.
Dion had recently watched a YouTube video in which an expert on such situations said that it is technically possible to represent such relationships within an RDBMS, but it is cumbersome.
Most NetIKX meetings incorporate one or two table-group
sessions to help people make sense of what they have learned. Here, people
are drawing graph data diagrams to Dion Lindsay’s suggestions.
Exercise
To get people used to thinking along graph database lines, Dion distributed a sheet of flip chart paper to each table, and big pens were found, and he asked each table group to start by drawing one circle for each person around the table, and label them.
The next part of the exercise was to create a circle for NetIKX, to which we all have a relationship (as a paid-up member or paying visitor), and also circles representing entities to which only some have a relation (such as employers or other organisations). People should then draw lines to link their own circle-entity to these others.
Dion’s previous examples had been about money-flows, and now he was asking us to draw lines to represent money-flows (i.e. if you paid to be here yourself, draw a line from you to NetIKX; but if your organisation paid, that line should go from your organisation-entity to NetIKX). I noted that aspect of the exercise engendered some confusion about the breadth of meaning that lines can carry in such a graph diagram. In fact they can represent any kind of relationship, so long as you have defined it that way, as Dion later clarified.
Dion had further possible tasks up his sleeve for us, but as time was short he drew out some interim conclusions. In graph databases, he summarised, you have connections instead of tables. These systems can manage many more complexities of relationships that either a RDBMS could cope with, or that we could cope with cognitively (and you can keep on adding complexity!). The graph database system can then show you what comes out of those complexities of relationship, which you had not been able to intuit for yourself, and this makes it a valuable discovery tool.
HOMEWORK: Dion suggested that as ‘homework’ we should take a look at an online tool and downloadable app which BP have produced to explore statistics of world energy use. The back end of this tool, Dion said, is based on a graph database.
https://www.bp.com/en/global/corporate/energy-economics/energy-charting-tool.html
Building Rich Search and Discovery: User Experiences with Linked Open Data – David Clarke
DAVE CLARKE is the co-founder, with Trish Yancey, of Synaptica LLC, which since 1995 has developed
enterprise-level software for building and maintaining many different types of knowledge organisation systems. Dave announced that he would talk about Linked Data applications, with some very practical illustrations of
what can be done with this approach.
The first thing to say is that Linked Data is based on an ‘RDF Graph’ — that is, a tightly-defined data structure, following norms set out in the Resource Description Framework (RDF) standards described by the World Wide Web Consortium (W3C).
In RDF, statements are made about resources, in expressions that take the form: subject – predicate – object. For example: ‘daffodil’ – ‘has the colour’ – ‘yellow’. (Also, ‘daffodil’ – ‘is a member of’ – ‘genus Narcissus’; and ‘Narcissus pseudonarcissus’ – ‘is a type of’ – ‘daffodil’.)
Such three-part statements are called ‘RDF triples’ and so the kind of database that manages them is often called an ‘RDF triple store’. The triples can also be represented graphically, in the manner that Dion had introduced us to, and can build up into a rich mass of entities and concepts linked up to each other.
Describing Linked Data and Linked Open Data
Dion had got us to do an exercise at our tables, but each table’s graph didn’t communicate with any other’s, like separate fortresses. This is the old database model, in which systems are designed not to share data. There are exceptions of course, such as when a pathology lab sends your blood test results to your GP, but those acts of sharing follow strict protocols.
Linked Data, and the resolve to be Open, are tearing down those walls. Each entity, as represented by the circles on our graphs, now gets its own ‘HTTP URI’, that is, its own unique Universal Resource Identifier, expressed with the methods of the Web’s Hypertext Transfer Protocol — in effect, it gets a ‘Web address’ and becomes discoverable on the Internet, which in turn means that connections between entities are both possible and technically fairly easy and fast to implement.
And there are readily accessible collections of these URIs. Examples include:
(see ‘Internal medicine’ as an example, at http://id.nlm.nih.gov/mesh/D007388)
(example concept ‘Renaissance’ at http://vocab.getty.edu/at/300021140)
(example, ‘Barack Obama’ at http://id.locx.gov/authorities/names/n94112934)
(example ‘London UK’ at http://www.geonames.org/2643743)
for example ‘inland surface waters’ at http://eunis/eea.europa.eu/habitats/58)
for example ‘finance’ at http://wordnet-rdf.princeton.edu/wn32/101136358-n)
We are all familiar with clickable hyperlinks on Web pages – those links are what weaves the ‘classic’ Web. However, they are simple pointers from one page to another; they are one-way, and they carry no meaning other than ‘take me there!’
In contrast, Linked Data links are semantic (expressive of meaning) and they express directionality too. As noted above, the links are known in RDF-speak as ‘predicates’, and they assert factual statements about why and how two entities are related. Furthermore, the links themselves have ‘thinginess’ – they are entities too, and those are also given their own URIs, and are thus also discoverable.
People often confuse Open Data and Linked Data, but they are not the same thing. Data can be described as being Open if it is available to everyone via the Web, and has been published under a liberal open licence that allows people to re-use it. For example, if you are trying to write an article about wind power in the UK, there is text and there are tables about that on Wikipedia, and the publishing licence allows you to re-use those facts.
Stairway through the stars
Tim Berners-Lee, who invented the Web, has more recently become an advocate of the Semantic Web, writing about the idea in detail in 2005, and has argued for how it can be implemented through Linked Data. He proposes a ‘5-star’ deployment scheme for Open Data, with Linked Open Data being the starriest and best of all. Dave in his slide-set showed a graphic shaped like a five-step staircase, often used to explain this five-star system:
The ‘five-step staircase’ diagram often used to explain the hierarchy of Open Data types
This hierarchy is explained in greater detail at http://5stardata.info/en/
Dave suggested that if we want to understand how many organisations currently participate in the ‘Linked Open Data Cloud’, and how they are linked, we might visit http://lod-cloud.net, where there is an interactive and zoomable SVG graphic version showing several hundred linked databases. The circles that represent them are grouped and coloured to indicate their themes and, if you hover your cursor over one circle, you will see an information box, and be able to identify the incoming and outgoing links as they flash into view. (Try it!)
The largest and most densely interlinked ‘galaxy’ in the LOD Cloud is in the Life Sciences; other substantial ones are in publishing and librarianship, linguistics, and government. One of the most central and most widely linked is DBpedia, which extracts structured data created in the process of authoring and maintaining Wikipedia articles (e.g. the structured data in the ‘infoboxes’). DBpedia is big: it stores nine and a half billion RDF triples!
Screen shot taken while zooming into the heart of the Linked Open Data Cloud (interactive version). I have positioned the cursor over ‘datos.bne.es’ for this demonstration. This brings up an information box, and lines which show links to other LOD sites: red links are ‘incoming’ and green links are ‘outgoing’.
The first case study Dave presented was an experiment conducted by his company Synaptica to enhance discovery of people in the news, and stories about them. A ready-made LOD resource they were able to use was DBpedia’s named graph of people. (Note: the Named Graphs data model is a variant on the RDF data model,: it allows RDF triples to talk about RDF graphs. This creates a level of metadata that assists searches within a graph database using the SPARQL query language).
Many search and retrieval solutions focus on indexing a collection of data and documents within an enterprise – ‘in a box’ if you like – and providing tools to rummage through that index and deliver documents that may meet the user’s needs. But what if we could also search outside the box, connecting the information inside the enterprise with sources of external knowledge?
The second goal of this Synaptica project was about what it could deliver for the user: they wanted search to answer questions, not just return a bunch of relevant electronic documents. Now, if you are setting out to answer a question, the search system has to be able to understand the question…
For the experiment, which preceded the 2016 US presidential elections, they used a reference database of about a million news articles, a subset of a much larger database made available to researchers by Signal Media (https://signalmedia.co). Associated Press loaned Synaptica their taxonomy collection, which covers more than 200,000 concepts covering names, geospatial entities, news topics etc. – a typical and rather good taxonomy scheme.
The Linked Data part was this: Synaptica linked entities in the Associated Press taxonomy out to DBpedia. If a person is famous, DBpedia will have hundreds of data points about that person. Synaptica could then build on that connection to external data.
SHOWING HOW IT WORKS. Dave went online to show a search system built with the news article database, the AP taxonomy, and a link out to the LOD cloud, specifically DBpedia’s ‘persons’ named graph. In the search box he typed ‘Obama meets Russian President’. The results displayed noted the possibility that Barack or Michelle might match ‘Obama’, but unhesitatingly identified the Russian President as ‘Vladimir Putin’ – not from a fact in the AP resource, but by checking with DBpedia.
As a second demo, he launched a query for ‘US tennis players’, then added some selection criteria (‘born in Michigan’). That is a set which includes news stories about Serena Williams, even though the news articles about Serena don’t mention Michigan or her birth-place. Again, the link was made from the LOD external resource. And Dave then narrowed the field by adding the criterion ‘after 1980’, and Serena stood alone.
It may be, noted Dave, that a knowledgeable person searching a knowledgebase, be it on the Web or not, will bring to the task much personal knowledge that they have and that others don’t. What’s exciting here is using a machine connected to the world’s published knowledge to do the same kind of connecting and filtering as a knowledgeable person can do – and across a broad range of fields of knowledge.
NATURAL LANGUAGE UNDERSTANDING. How does this actually work behind the scenes? Dave again focused on the search expressed in text as ‘US tennis players born in Michigan after 1980’. The first stage is to use Natural Language Understanding (NLU), a relative of Natural Language Processing, and long considered as one of the harder problem areas in Artificial Intelligence.
The Synaptica project uses NLU methods to parse extended phrases like this, and break them down into parts of speech and concept clusters (‘tennis players’, ‘after 1980’). Some of the semantics are conceptually inferred: in ‘US tennis players’, ‘US’ is inferred contextually to indicate nationality.
On the basis of these machine understandings, the system can then launch specific sub-queries into the graph database, and the LOD databases out there, before combining them to derive a result. For example, the ontology of DBpedia has specific parameters for birth date, birthplace, death date, place of death… These enhanced definitions can bring back the lists of qualifying entities and, via the AP taxonomy, find them in the news content database.
Use case: understanding symbolism inside art images
Dave’s second case study concerned helping art history students make searches inside images with the aid of a Linked Open Data resource, the Getty Art and Architecture Thesaurus.
A seminal work in Art History is Erwin Panofsky’s Studies in Iconology (1939), and Dave had re-read it in preparation for building this application, which is built on Panofskyan methods. Panofsky describes three levels of analysis of iconographic art images:
Detail from the left panel of Hieronymous Bosch’s painting ‘The Garden of Earthly Delights’, which is riddled with symbolic iconography.
THE ‘LINKED CANVAS’ APPLICATION.
The educational application which Synaptica built is called Linked Canvas (see http://www.linkedcanvas.org/). Their first step was to ingest the art images at high resolution. The second step was to ingest linked data ontologies such as DBpedia, Europeana, Wikidata, Getty AAT, Library of Congress Subject Headings and so on.
The software system then allows users to delineate Points of Interest (POIs), and annotate them at the natural level; the next step is the semantic indexing, which draws on the knowledge of experts and controlled vocabularies.
Finally users get to benefit from tools
for search and exploration of the
annotated images.
With time running tight, Dave skipped straight to some live demos of examples, starting with the fiendishly complex 15th century triptych painting The Garden of Earthly Delights. At Panofsky’s level of ‘natural analysis’, we can decompose the triptych space into the left, centre and right panels. Within each panel, we can identify ‘scenes’, and analyse further into details, in a hierarchical spatial array, almost the equivalent of a detailed table of contents for a book. For example, near the bottom of the left panel there is a scene in which God introduces Eve to Adam. And within that we can identify other spatial frames and describe what they look like (for example, God’s right-hand gesture of blessing).
To explain semantic indexing, Dave selected an image painted 40 years after the Bosch — Hans Holbein the Younger’s The Ambassadors, which is in the National Gallery in London. This too is full of symbolism, much of it carried by the various objects which litter the scene, such as a lute with a broken string, a hymnal in a translation by Martin Luther, a globe, etc. To this day, the meanings carried in the painting are hotly debated amongst scholars.
If you zoom in and browse around this image in Linked Canvas, as you traverse the various artefacts that have been identified, the word-cloud on the left of the display changes contextually, and what this reveals in how the symbolic and contextual meanings of those objects and visual details have been identified in the semantic annotations.
An odd feature of this painting is the prominent inclusion in the lower foreground of an anamorphically rendered (highly distorted) skull. (It has been suggested that the painting was designed to be hung on the wall of a staircase, so that someone climbing the stairs would see the skull first of all.) The skull is a symbolic device, a reminder of death or memento mori, a common visual trope of the time. That concept of memento mori is an element within the Getty AAT thesaurus, and the concept has its own URI, which makes it connectable to the outside world.
Dave then turned to Titian’s allegorical painting Bacchus and Ariadne, also from the same period and also from the National Gallery collection, and based on a story from Ovid’s Metamorphoses. In this story, Ariadne, who had helped Theseus find his way in and out of the labyrinth where he slew the Minotaur, and who had become his lover, has been abandoned by Theseus on the island of Naxos (and in the background if you look carefully, you can see his ship sneakily making off). And then along comes the God of Wine, Bacchus, at the head of a procession of revellers and, falling in love with Ariadne at first glance, he leaps from the chariot to rescue and defend her.
Following the semantic links (via the LOD database on Iconography) can take us to other images about the tale of Ariadne on Naxos, such as a fresco from Pompeii, which shows Theseus ascending the gang-plank of his ship while Ariadne sleeps. As Dave remarked, we generate knowledge when we connect different data sets.
Another layer built on top of the Linked Canvas application was the ability to create ‘guided tours’ that walk the viewer around an image, with audio commentary. The example Dave played for us was a commentary on the art within a classical Greek drinking-bowl, explaining the conventions of the symposium (Greek drinking party). Indeed, an image can host multiple such audio commentaries, letting a visitor experience multiple interpretations.
In building this image resource, Synaptica made use of a relatively recent standard called the International Image Interoperability Framework (IIIF). This is a set of standardised application programming interfaces (APIs) for websites that aim to do clever things with images and collections of images. For example, it can be used to load images at appropriate resolutions and croppings, which is useful if you want to start with a fast-loading overview image and then zoom in. The IIIF Search API is used for searching the annotation content of images.
Searching within Linked Canvas is what Dave described as ‘Level Three Panofsky’. You might search on an abstract concept such as ‘love’, and be presented us with a range of details within a range of images, plus links to scholarly articles linked to those.
Post-Truth Forum
As a final example, Dave showed us http://www.posttruthforum.org, which is an ontology of concepts around the ideas of ‘fake news’ and the ‘post-truth’ phenomenon, with thematically organised links out to resources on the Web, in books and in journals. Built by Dave using Synaptica Graphite software, it is Dave’s private project born out of a concern about what information professionals can do as a community to stem the appalling degradation of the quality of information in the news media and social media.
For NetIKX members (and for readers of this post), going to Dave’s Post Truth Forum site is also an opportunity to experience a public Linked Open Data application. People may also want to explore Dave’s thoughts as set out on his blog, www.davidclarke.blog.
Taxonomies vs Graphs
In closing, Dave wanted to show a few example that might feed our traditional post-refreshment round-table discussions. How can we characterise the difference between a taxonomy and a data graph (or ontology)? His first image was an organisation chart, literally a regimented and hierarchical taxonomy (the US Department of Defense and armed forces).
His second image was the ‘tree of life’ diagram, the phylogenetic tree that illustrates how life forms are related to each other, and to common ancestor species. This is also a taxonomy, but with a twist. Here, every intermediate node in the tree not only inherits characteristics from higher up, but also adds new ones. So, mammals have shared characteristics (including suckling young), placental mammals add a few more, and canids such as wolves, jackals and dogs have other extra shared characteristics. (This can get confusing if you rely too much on appearances: hyenas look dog-like, but are actually more closely related to the big cats.)
So the Tree of Life captures systematic differentiation, which a taxonomy typically cannot. However, said Dave, an ontology can. In making an ontology we specify all the classes we need, and can specify the property sets as we go. And, referring back to Dion’s presentation, Dave remarked that while ontologies do not work easily in a relational database structure, they work really well in a graph database. In a graph database you can handle processes as well as things and specify the characteristics of both processes and things.
Dave’s third and final image was of the latest version of the London Underground route diagram. This is a graph, specifically a network diagram, that is characterised not by hierarchy, but by connections. Could this be described in a taxonomy? You’d have to get rid of the Circle line, because taxonomies can’t end up where they started from. With a graph, as with the Underground, you can enter from any direction, and there are all sorts of ways to make connections.
We shouldn’t think of ditching taxonomies; they are excellent for some information management jobs. Ontologies are superior in some applications, but not all. The ideal is to get them working together. It would be a good thought-experiment for the table groups to think about what, in our lives and jobs, are better suited to taxonomic approaches and what would be better served by graphs and ontologies. And, we should think about the vast amounts of data out there in the public domain, and whether our enterprises might benefit from harnessing those resources.
Discussion
Following NetIKX tradition, after a break for refreshments, people again settled down into small table groups. We asked participants to discuss what they had heard and identify either issues they thought worth raising, or thinks that they would like to know more about.
I was chairing the session, and I pointed out that even if we didn’t have time in subsequent discussion to feed everyone’s curiosity, I would do my best to research supplementary information to add to this account which you are reading.
I ran the audio recorder during the plenary discussion, so even though I was not party to what the table groups had discussed internally, I can report with some accuracy what came out of the session. Because the contributions jumped about a bit from topic to topic, I have resequenced them to make them easier for the reader to follow.
AI vs Linked Data and ontologies?
Steve Dale wondered if these efforts to compile graph databases and ontologies was worth it, as he believed Artificial Intelligence is reaching the point where a computer can be thrown all sorts of data – structured and unstructured – and left to figure it out for itself through machine learning algorithms. Later, Stuart Ward expressed a similar opinion. Speaking as a business person, not a software wizard, he wonders if there is anything that he needs to design?
Conrad, in fielding this question, mentioned that on the table he’d been on (Dave Clarke also), they had looked some more into the use in Dave’s examples of Natural Language Understanding; that is a kind of AI component. But they had also discussed the example of the Hieronymous Bosch painting. Dave himself undertook the background research for this and had to swot up by reading a score of scholarly books. In Conrad’s opinion, we would have to wait another millennium before we’d have an AI able to trace the symbolism in Bosch’s visual world. Someone else wondered how one strikes the right balance between the contributions of AI and human effort.
Later, Dave Clarke returned to the question; in his opinion, AI is heavily hyped – though if you want investment, it’s a good buzz-word to throw about! So-called Artificial Intelligence works very well in certain domains, such as pattern recognition, and even with images (example: face recognition in many cameras). But AI is appalling at semantics. At Synaptica, they believe that if you want to create applications using machine intelligence, you must structure your data. Metadata and ontologies are the enablers for smart applications.
Dion responded to Stuart’s question by saying that it would be logical at least to define what your entities are – or at least, to define what counts as an entity, so that software can identify entities and distinguish them from relationships. Conrad said that the ‘predicates’ (relationships) also need defining, and in the Linked Data model this can be assisted if you link out to publicly-available schemas.
Dave added that, these days, in the Linked Data world, it has become pretty easy to adapt your database structures as you go along. Compared to the pain and disruption of trying to modify a relational database, it is easy to add new types of data and new types of query to a Linked Data model, making the initial design process less traumatic and protracted.
Graph databases vs Linked Open Data?
Conrad asked Dave to clarify a remark he had made at table level about the capabilities of a graph database product like Neo4j, compared with Linked Open Data implementations.
Dave explained that Neo4j is indeed a graph database system, but it is not an RDF database or a Linked Data database. When Synaptica started to move from their prior focus on relational databases towards graphical databases, Dave became excited about Neo4j (at first). They got it in, and found it was a wonderfully easy system to develop with. However, because its method of data modelling is not based on RDF, Neo4j was not going to be a solution for working with Linked Data; and so fervently did Dave believe that the future is about sharing knowledge, he pulled the plug on their Neo4j development.
He added that he has no particular axe to grind about which RDF database they should use, but it has to be RDF-conforming. There are both proprietary systems (from Oracle, IBM DB2, OntoText GraphDB, MarkLogic) and open-source systems (3store, ARC2, Apache Jena, RDFLib). He has found that the open-source systems can get you so far, but for large-scale implementations one generally has to dip into the coffers and buy a licence for something heavyweight.
Even if your organisation has no intention to publish data, designing and building as Linked Data lets you support smart data and machine reasoning, and benefit from data imported from Linked Open Data external resources.
Conrad asked Dion to say more about his experiences with graph databases. He said that he had approached Tableau, who had provided him with sample software and sample datasets. He hadn’t yet had a change to engage with them, but would be very happy to report back on what he learns.
Privacy and data protection
Clare Parry raised issues of privacy and data protection. You may have information in your own dataset that does not give much information about people, and you may be compliant with all the data protection legislation. However, if you pull in data from other datasets, and combine them, you could end up inferring quite a lot more information about an individual.
(I suppose the answer here is to do with controlling which kinds of datasets are allowed to be open. We are on all manner of databases, sometimes without suspecting it. A motor car’s registration details are held by DVLA, and Transport for London; the police and TfL use ANPR technology to tie vehicles to locations; our banks have details of our debit card transactions and, if we use those cards to pay for bus journeys, that also geolocates us. These are examples of datasets that by ‘triangulation’ could identify more about us than we would like.)
URI, URL, URN
Graham Robertson reported that on his table they discussed what the difference is between URLs and URIs…
(If I may attempt an explanation: the wider term is URI, Uniform Resource Identifier. It is ‘uniform’ because everybody is supposed to use it the same way, and it is supposed uniquely and unambiguously to identify anything which might be called a ‘resource’. The Uniform Resource Locator (URL) is the most common sub-type of URI, which says where a resource can be found on the Web.
But there can be other kinds of resource identifiers: the URN (Uniform Resource Name) identifies a resource that can be referenced within a controlled namespace. Wikipedia gives as an example ISBN 0-486-27557-4, which refers to a specific edition of Shakespeare’s Romeo and Juliet. In the MeSH schema of medical subject headings, the code D004617 refers to ‘embolism’.)
Trustworthiness
Some people had discussed the issue of the trustworthiness of external data sources to which one might link – Wikipedia (and WikiData and DBpedia) among them, and Conrad later asked Mandy to say more about this. She wondered about the wisdom of relying on data which you can’t verify, and which may have been crowdsourced. But Dave has pointed out that you might have alternative authorities that you can point to. Conrad thought that for some serious applications one would want to consult experts, which is how the Getty AAT has been built up. Knowing provenance, added David Penfold, is very important.
The librarians ask: ontologies vs taxonomies?
Rob Rosset’s table was awash with librarians, who tend to have an understanding about what is a taxonomy and what an ontology. How did Dave Clarke see this, he asked?
Dave referred back to his closing three slides. The organisational chart he had shown is a strict hierarchy, and that is how taxonomies are structured. The diagram of the Tree of Life is an interesting hybrid, because it is both taxonomic and ontological in nature. There are things that mammals have in common, related characteristics, which are different from what other groupings such as reptiles would have.
But we shouldn’t think about abandoning taxonomy in favour of ontology. There will be times where you want to explore things top-down (taxonomically), and other cases where you might want to explore things from different directions.
What is nice about Linked Data is that it is built on standards that support these things. In the W3C world, there is the SKOS standard, Simple Knowledge Organization Systems, very light and simple, and there to help you build a taxonomy. And then there is OWL, the Web Ontology Language, which will help you ascend to another level of specificity. And in fact, SKOS itself is an ontology.
Closing thoughts and resources
This afternoon was a useful and lively introduction to the overlapping concepts of Graph Databases and Linked Data, and I hope that the above account helps refresh the memories of those who attended, and engage the minds of those who didn’t. Please note that in writing this I have ‘smuggled in’ additionally-researched explanations and examples, to help clarify matters.
Later in the year, NetIKX is planning a meeting all about Ontologies, which will be a way to look at these information and knowledge management approaches from a different direction. Readers may also like to read my illustrated account of a lecture on Ontologies and the Semantic Web, which was given by Professor Ian Horrocks to a British Computer Society audience in 2005. That is still available as a PDF from http://www.conradiator.com/resources/pdf/Horrocks_needham2005.pdf
Ontologies, taxonomies and knowledge organisation systems are meat and drink to the UK Chapter of the International Society for Knowledge Organization (ISKO UK), and in September 2010 ISKO UK held a full day conference on Linked Data: the future of knowledge organization on the Web. There were nine speakers and a closing panel session, and the audio recordings are all available on the ISKO UK Web site, at http://www.iskouk.org/content/linked-data-future-knowledge-organization-web
Recently, the Neo4j team produced a book by Ian Robinson, Jim Webber and Emil Eifrem called ‘Graph Databases’, and it is available for free (PDF, Kindle etc) from https://neo4j.com/graph-databases-book/ Or you can get it published in dead-tree form from O’Reilly Books. See https://www.amazon.co.uk/Graph-Databases-Ian-Robinson/dp/1449356265
January 2018 Seminar: Making true connections in a complex world: new technologies to link facts, concepts and data
/in Events 2018, Knowledge and information organisation and modelling, Organisation and modelling:linked data, Previous Events/by NetikxSummary
At this meeting new approaches to Linked Data and Graph Technology were presented and discussed. Dion Lindsay introduced the New Graph Technology of Information and David Clarke discussed Building Rich Search and Discovery User Experiences with Linked Open Data.
Speakers
Dion Lindsay
Introducing the New Graph Technology of Information. Graph technology is a rapidly growing method of making complex datasets visually engaging and explorable in new ways, revealing hidden patterns and creating actionable insights. Graph technology is being applied to the vast and unruly sets of unstructured data, with which traditional relational database technology has not been able to come to terms, but which enterprises own and are anxious to exploit.
David Clarke
Building Rich Search and Discovery User Experiences with Linked Open Data This presentation will demonstrate how to leverage Linked Open Data for search and discovery applications. The Linked Open Data cloud is a rapidly growing collection of publicly accessible
resources, which can be adopted and reused to enrich both internal enterprise projects and
public-facing information systems. Linked Open Data resources live in graph databases, formatted as RDF triple stores. Two use-cases will be explored.
Time and Venue
2pm on 25th January 2018, The British Dental Association, 64 Wimpole Street, London W1G 8YS
Pre Event Information
NetIKX offers KM and IM professions a chance to increase our understanding of the new technology approaches that are changing and challenging our work. Our next seminar will give you a chance to confidently discuss and assess the opportunities of new approaches to Linked Data and Graph Technology that can enhance your work and your organisational value.
In everyday language, a ‘graph’ is a visual representation of quantitative data. But in computing and information management, the word can also refer to a data structure in which entities are considered as nodes in a network diagram, with links (relationships) between some of them.
Both the entities and the relationships can also be recorded as having ‘properties’ or ‘attributes’, quantitative and qualitative.
Slides
No slides available for this presentation
Tweets
#netikx89
Blog
Blog link
See our blog report: Making True Connections
Study Suggestions
The Neo4j team produced a book by Ian Robinson, Jim Webber and Emil Eifrem called ‘Graph Databases’, and it is available for free (PDF, Kindle etc) from https://neo4j.com/graph-databases-book/