
The Future of Work for Information and Knowledge Professionals
To celebrate the tenth anniversary of NetIKX, the November 2017 meeting was opened free of charge to people from related knowledge and information management organisations. It featured two speakers, Peter Thomson and Stuart Ward, and an extended panel session with questions from the audience.
Peter Thomson on the changing world of work
Peter Thomson is a consultant who advises clients about how to create a corporate culture supporting new and better working practices. He is the author of ‘Future Work’, a visiting Executive Fellow at Henley Business College, and the Research Director of the Telework Association. Amongst his current engagements, he is helping the Health Foundation to launch a community of 1,000 health improvement practitioners, and working with Medécins sans Frontières on developing a knowledge-based evaluation process for their humanitarian response missions.
Thirty years ago he worked for Digital Equipment Corporation (DEC), known for its PDP and Vax lines of multi-user minicomputers. DEC experimented with new ways of networking, and with long-distance working. Surely, they thought, nobody in the 21st century would come to work getting stuck in traffic jams or packed into suburban trains – they would be sitting comfortably at home and ‘teleworking’ – it was a big buzzword at that time, but is now pretty much extinct.
With the benefit of hindsight, Peter notes that technology has changed but people haven’t. Human behaviour is full of ingrained habits, especially so amongst leaders of organisations. So we have the absurdity of people being forced to commute to sit at a desk, and send emails to the person a few metres away.
The younger generation is beginning to question why we continue with these outmoded working practices. The absurdity persists because business leaders want their team around them, under their eye, in a ‘command and control’ notion of how to run a business.
New tech, old habits
He asked: most of the audience have a smartphone, yes? How many had used it that day to actually telephone somebody – compared to sending or reading email, or other text based message? A show of hands showed that the latter was more prevalent than the former.
Although mobile devices and related technologies are now part of our everyday lives, and the world has become more complex, many of our practices in the world of work are still trying to catch up. Businesses may boast of being Agile, but many of the actual processes are Fragile, he said.
Business communication is spread across a spectrum of behaviours. People still like to get together physically in groups to discuss things. In that setting they employ not only words, but also nuances of expression, gesture, body language and so on. At the other end of the spectrum is email: asynchronous, and text-based (with quite a narrow medium of expression). Ranged in the middle we have such things are videoconferencing, audio conference calls, Skype etc.
Daily business communication is conducted mostly by typing emails – probably slowly – then checking for typing mistakes. Wouldn’t it be quicker to use new technology to send a quick video message? It’s technically possible these days. Look at how people have adopted WhatsApp in their personal lives. But the corporate default is face-to-face physical meetings, email at the other end, and nothing in between. Indeed, the social media tools by which people communicate daily in ordinary life are banned from many workplaces. And then people complain of having too many emails and too many meetings.
Tyranny of 24/7 and the overwork culture
Many people today are the victims of ‘presenteeism’. If you are not already at your desk and working when your managers show up, or if you leave your desk before they do, they won’t be impressed. They can’t sack you for sticking to the hours you are contracted for, but you’ll probably be passed over for promotion. Even if you’re the one who comes up with the best creative ideas, that’s regarded as incidental, secondary to the quantitative measure of how many hours you work.
This has now extended into, or been replaced by, a form of virtual presenteeism. Knowledge and administration work can now be done anywhere. So now we have digital presenteeism, 24/7. ‘Please take your laptop on holiday with you, in case there’s an emergency – and check in every day.’ Or, ‘I tend to send emails over the weekend, and while I don’t insist that you reply to them immediately, those who do are the ones I’ll favour.’ These leadership behaviours force people to be in work mode round the clock. It all builds stress, which the World Health Organization says is a 21st century epidemic.
But many people now won’t work under these conditions. They’d rather quit and set up their own business, or join the ‘gig economy’. They want to own their own time. If you got used to budgeting your time how you see fit, for example at university, you don’t want to be treated like a child by an employer, and be told when to do what.
The typical contract of employment is not about what you achieve – it’s about your hours of work, and you are paid according to the time you spend at work. For example, consider a mother who returns from maternity leave and agrees to work a four-day week rather than five. She benefits from having the extra time; the employer may also benefit, because in trying to get the same work done in four rather than five days a week, she probably skips unproductive meetings and spends less time chatting. But after a while, she finds that however productive she is, she’s being paid four-fifths of what her colleagues are.
At a national level, Peter commented, Britain is quite low on the productivity scale, and yet our working hours are so long.
Challenges to permanent employment
There has been a trend towards outsourcing and subcontracting: consider call centres in India or companies having products made in China. Will there now be a second wave of this, at the management and administration level, in which inefficient layers are taken out of corporate organisations and the organisation gets the professional inputs it needs from subcontractors?
We’re seeing the collapse of the pension paradigm. The conventional model is predicated on the idea of ‘superannuation’, and a few years of retirement before you die. But with today’s longer lifespans, thinking of seniors as being too old to contribute knowledge and skills is increasingly untenable — and anyway, it’s proving impossible to fund a long retirement from the proceeds of 40 years of employment. Nor can the State pension scheme fund extended pensions from the taxes paid by (a declining proportion of) younger people in work. Is retirement then an antiquated idea?
Peter closed by wondering what people’s ideal workplace might be — where they are at their most creative. Within the audience, people mentioned a variety of domestic settings, plus walking and driving. Peter imagines the organisation of the future as a network of people, working in such conducive conditions, and connected by all the liberating means that technology can bring us. Are we ready for this new world?
Stuart Ward on KIM and adding value to organisations
Stuart was the first chair of NetIKX and has been involved with our community throughout. The first meeting of NetIKX was addressed by David Skyrme, who spoke about the value of knowledge and information management (KIM for short, hereafter); that would also be the main focus of his presentation. He believes that it can be challenging for KIM professionals (KIPs) to prove their value to the organisations in which they work.
Knowledge and information are the life-blood of organisations; those who use them well will prosper, those who don’t will wither. From that, one might expect the KIPs to be highly valued, but often it is not the case.
Stuart identifies four things he thinks are important if KIPs are to survive and flourish in an organisation. They are: to focus on creating value; to link KIM activities to the organisation’s goals and objectives; to be clear about everyone’s responsibilities in relation to KIM (and there are various such roles, whether in creating and disseminating information products, or managing data and information resources). Finally, the organisation must have the right structures, skills and culture to make best use of what KIM can provide.
‘Value’ means different things in different enterprises. Commerce will focus on value for shareholders and other stakeholders, and customer service. In the public sector, and for non-profits, value could mean packaging information so that citizens and other service users can make best use of it.
A six-part model
Stuart has long promoted a model that is structured around six mechanisms through which information and knowledge can be used to deliver value to an organisation. They are:
- developing information and knowledge products which can be marketed;
- helping to drive forward the business strategy;
- enabling organisational flexibility and change;
- improving corporate decision making;
- enabling and improving all business processes, especially the key ones; and
- enhancing the organisation’s ‘intellectual capital’.
Looking at these in turn…
Information and knowledge products: Some businesses (publishers, media companies, law firms etc) create products for sale to the public or to other businesses. Others, such as local government or non-profits, produce reports and studies: though not for sale, these are crucial in their work of informing the public, influencing government or what have you.
Driving business strategy and renewal: Organisations often must change to survive, and here KIM can deliver value by enabling innovation. Apple Computer almost hit the rocks a couple of times, but through KIM and innovative product and service design became highly profitable. It’s important to sense the direction the market is headed: Blackberry and Nokia are examples of companies which failed to do that.
Enabling organisational change and flexibility: Good KIM helps an organisation to be sensitive to changing business opportunities and risks, to improve efficiency and cut costs. Here, the last thing one needs is to have knowledge trapped within silos. Efficient sharing of knowledge and information across the organisation is key.
Improving decision making: The mantra is, ‘Get the right information at the right time, to the right people.’ Good decision making requires an understanding of options available, and the consequences of making those choices – including the risks. Bad decisions are often made because of the prejudices of the decision-makers, who have the power to prevail in the face of evidence, so it’s important that the organisation has the right cultural attitudes towards decision-making, knowledge and information.
Continuous improvement: Almost always, business processes could be done better, and proper curation of information and knowledge is the key to this. Good ideas need not be limited to a discrete business process, and can inspire changes in other activities.
Enhancing intellectual capital: One of the most important realisations in KIM is that, just as money and equipment and premises and people are assets to a business, so are information and knowledge, and they should be managed properly. Yet many organisations don’t have an overview of what those intellectual assets are. As engineer Lewis Platt, 1990s CEO of Hewlett-Packard once said, ‘If we only knew what we know, we’d be three times more profitable.’ (Platt was also famous for his practice of ‘management by walking around’, immersing himself in the operational side of the business rather than staying aloof in his office.)
Linking KIM to key goals: the benefits matrix
Stuart then proposed a methodology for fitting IM and KM to an organisation’s key goals and objectives. As a tool, he recommends a ‘benefits matrix’ diagram, somewhat like a spreadsheet, in which the row headings define the organisation’s goals, its aims and objectives, while column headings define existing or possible future KIM services and capabilities. This creates an array of cells, each one of which represents how one particular KIM service or capability maps to one of the organisation’s goals. In these cells, you can then list the benefits, which may be quantifiable (e.g. increased income, reduced cost) or unquantifiable.
Stuart gave the example of an organisation having a Document Management System (represented as a column on the matrix). How might that map across to the company’s goal of reducing overhead costs? Well, a quantifiable result might be the saving of £160K a year, while unquantifiable benefits could include faster access to information, and a reduced risk of losing critical information.
Stuart likes this kind of exercise, because it stimulates thinking about the way in which information and knowledge management initiatives can generate benefits for the organisation’s self-identified objectives. It isn’t narrow-minded with a focus only on quantifiable benefits, though it does stimulate thinking about how one might define metrics, valuable for monitoring results. Finally, it is strongly visual and easy to assimilate, and as such is good for engaging with senior management.
Responsibilities, capabilities
It would be a mistake to assume that KIM responsibilities attach only to people explicitly employed for a KIM role. Business leaders also have strategic responsibilities for KIM, and every ‘ordinary’ worker has KIM responsibilities too. There are special defined responsibilities for those with ‘steward’ roles, for those who create and manage information and knowledge resources as their main job, and also those who manage IT and other kinds of infrastructure and services which help to manage and deliver the resources to where they are needed.
Stuart’s slide set included several detailed bullet-point slides for the KIM responsibilities that might attach to these various roles, but we skipped over a detailed examination these due to pressure of time. [The slide set is available at www.netikx.org to NetIKX members and to those who attended the meeting.]
A cyclical process
Stuart’s final diagram suggested that there is a cyclical process between two spheres: the first sphere represents the organisation’s data and information, and what it knows. Through good management and use of these resources, the organisation hopefully performs well and succeeds in the second sphere, that of action. By monitoring performance, the organisation can learn from experience, and that feeds back to the first sphere.
Learning from the Hawley Committee
In 1995 the Hawley Committee, chaired by Sir Robert Hawley, under the auspices of the KPMG IMPACT Programme, published the results of an investigation into information management, and the value assigned to information, in several large UK businesses. Entitled ‘Information as an Asset – The Board Agenda’, the report set out ten agenda points, of which three have to do with responsibilities of the Board of Management. CILIP have recently shown a renewed interest in the Hawley Report, and may soon republish it, with updates to take account of changes between then and now.
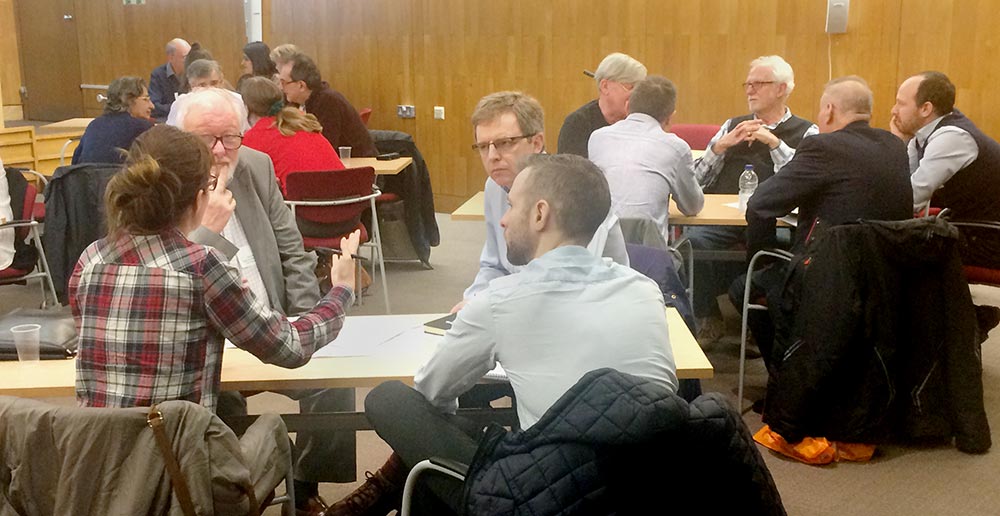
Panel Q&A session
The panel discussion session had something of a BBC ‘Any Questions’ flavour. Before the session, people sat in table groups and came up with written questions, which Panel chair David Penfold then collected and collated during our tea break. David then called for questions which were similar to be put to the panel, which consisted of Noeleen Schenk of Metataxis, David Gurteen, David Smith (Government KIM Head of Profession), Karen McFarlane (Chair of CILIP Board), David Haynes (chair of ISKO UK) and Steve Dale.
Will KIM professionals become redundant?
Stuart Ward asked for the panel’s opinion about whether knowledge and information management professionals might soon be redundant, as their skills are diffused to a wider group of people through their exposure to technology in school and university. Joanna asked how we can create knowledge from the exponentially growing amount of information; and Alison wondered if the information available to all on Wikipedia is good enough; or are we looking for a perfect solution which doesn’t exist?
Steve Dale responded mostly to Stuart’s question. He has observed how in most of the organisations with which he works, KIM functions are being spread around the organisation. Organisations like Cadbury’s, the British Council and PWC no longer have a KIM department per se. Knowledge has become embedded in the organisation. But Steve still sees a future role for KIM professionals (or their equivalent – they may be called something else) as organisations turn to machine-augmented decision-making, ‘big data’, and machine learning.
Consider machine learning, in which computer systems are fed with truckloads of data, and process that to discover patterns and connection. If there is bias in the data, there will be bias in the outcomes – who is checking for that? This is where wise and knowledgeable humans can and should intervene to manage the quality of the data, and to ensure that any ‘training set’ is truly representative.
Karen McFarlane also responded to Stuart’s question. With her GCHQ and National Cybersecurity Centre background, she sees a continued and deepening need for skills in data and information governance, information assurance and cyber-security; also in information risk management, and data quality. KIM professionals have those kinds of skills. As for Stuart’s assertion that exposure to technology at university is enough to impart those skills – she thinks that is definitely not the case. Such people often don’t know how to manage the information on their desktops [let alone at an enterprise level].
Noeleen Schenk in contrast replied that she didn’t think it should be necessary to teach people how to manage the information they work with, so long as there were rule-based technical systems to do information governance automatically (for example, though auto-categorisation). But who will write the rules? That’s where the future of KIM work may lie.
David Haynes offered the perspective of someone teaching the next generation of KIM professionals (at Dundee and at City University of London). He is impressed by the diversity of backgrounds among people drawn to take courses in Library and Information Studies, and Archives and Records Management: it shows how relevant these skills are to many fields of human activity. He would like to see in future a larger emphasis on information governance skills, because many LIS-trained people go on to take up roles as data protection officers, or working on compliance matters.
David Smith thinks KIM professionals do risk extinction if they don’t change. He remembers that when he joined the Civil Service, doing online search was an arcane craft for specialists – that’s gone! He agrees that information governance is a key skill. Could anyone do that? Yes… Would they make mistakes? Certainly! This is where KIM professionals should be asserting their skills and gaining a reputation for being the go-to person for help in such matters.
David Gurteen doesn’t think the need to manage information and knowledge will go away – quite the reverse. One recently-arising topic has been that of ‘fake news’ and bias, which for him highlights the need for information and media literacy skills and judgement to be taught and learnt.
Training the robots?
Claire Parry referred to the greater availability today of information which has been structured to be ‘understandable’ by machines as well as by humans. What did the panel think might be KIM professionals’ roles in training the machines, and dealing with ‘bots’.
Steve Dale said that artificial intelligence has been a big interest of his in recent years. A lot of young people are out there coding algorithms, and some machines are even crafting their own through machine learning. That’s fine for game-playing, but in matters of more importance, affecting the lives of citizens, we must be concerned when machines evolve their own algorithms that we don’t understand. The House of Commons Science and Technology Committee is requesting information from organisations creating these kinds of tools, so they can consider the implications. Steve said that, when some algorithm is being used to augment decision-making in a way which affects him, he wants to know about it, and about what data is being used to inform it.
Rob Rosset wondered whether it is possible to create an algorithm that does not have some form of bias within it. David Gurteen thought ‘bias’ was inevitable, given that programming always proceeds from assumptions. Noeleen Schenk thought that good data governance could at least reveal to us the provenance and quality of the data being used to inform decisions. David Haynes agreed, and referred to the ‘ethics of information’, noting that CILIP’s model of the Wheel of Knowledge places ethics at the very centre of that diagram.
Steve Dale mentioned he had just been at an event about whether AI will lead to job losses, and people there discussed the algorithms that Facebook uses. Facebook now realises that they can’t detect online abuse algorithmically, so are in the process of recruiting 10,000 humans to moderate the algorithms! So the adoption of AI maybe bringing up job opportunities?
The gig economy; face-to-face vs virtual working
David Penfold brought forward four questions which he thought might be related to each other.
Kathy Jacob asked, what impact will ‘gig economy’ workforce arrangements have on knowledge and information work in the future? Particularly in the aspects of knowledge creation and use. Valerie Petruk asked, is the gig economy a necessary evil? Sarah Culpin wondered how to get the right balance between face-to-face interactions and virtual working spaces; and Jordana Moser similarly wondered how we organise to meet human needs as well as the demands of efficiency and productivity. For example, a face-to-face meeting may not be the most efficient way of getting work done, but has value on other levels.
David Smith thought that the ‘gig economy’ probably is a necessary evil. Records management for government has become increasing commoditised: when a task emerges, you buy in people to do it, then they go. It’s a balancing act, because some work is more appropriately done by people on the payroll, and some doesn’t have to be. Procurement skills have therefore become more important – deciding what work you keep in-house, and what you farm out, or get people in for on a temporary basis.
David Haynes noted the loss of rights that comes along with the ‘gig economy’ – being employed has benefits for people. He himself has been both employed and self-employed – it’s worked out just fine for him, but people engaged for more routine tasks can be easily exploited; when they are ill, they aren’t paid; they don’t get holiday pay, etc. Peter Thompson in his talk had proposed being ‘paid by the piece’ rather than for time on the job, but David thinks that going down this path not only imposes on individuals, but brings a cost to the whole of society too.
Noeleen Schenk finds that a ‘gig economy’ approach suits her, because she likes a portfolio lifestyle. If you combine it with the Internet’s opportunities for long-distance working, it’s brilliant that an enterprise can find someone with just the skills they want, who can provide that service from the other side of the world.
Moving to address Kathy Jacobs’s question directly, Noeleen thinks that knowledge capture will move from writing things down towards voice capture, plus voice-to-text conversion, such that there will be fewer low-grade tasks to be assigned to temporary workers. However, what gig work methods do risk losing is the organisational knowledge that comes with continuity of shared experience in the enterprise.
Karen McFarlane said that we need both face-to-face and distant working. We are humans; we work best in a human way. We can blend in virtual meetings, virtual communities; but these virtualised relationships always work best if you have met the other person(s) in real life.
David Gurteen is definitely in favour of face to face conversation. He has been experimenting holding his Knowledge Café meetings using Zoom technology, but he thinks, if you can meet face to face, it’s better. Doing it remotely is something you do if you have to. Nancy Dixon talks about the ‘oscillation principle’ – if you have a geographically dispersed team, every so often you have to bring them together (see her blog post at https://www.druckerforum.org/blog/p=881 – she talks about ‘blend[ing] sophisticated virtual tools with periodic, in-depth, face-to-face collective sensemaking.’)
Recruitment criteria, and the robots (again)
Judith Stuart, who lectures at the University of the West of England, asked what skills and knowledge the panel look for in new recruits and appointments to knowledge management roles in organisations.
David Haynes replied in one word: ‘flexibility’, and other panelists agreed, David Gurteen would add ‘curiosity’. Noeleen’s answer was similar – adaptability, and the ability to cope with uncertainty.
Karen McFarlane said that when she used to recruit people to roles in records, information or knowledge management, she looked out for people who had a love of information. Yes, flexibility was also amongst her criteria, but also the inter-personal skills to be able to work in a team.
David Penfold thought it was interesting that no-one had mentioned professional skills! Karen replied that of course those were required, but her response to the question was about what would make a candidate ‘stand out’ in her eyes. Noeleen added that professional skills can be learned, but the softer skills can’t so easily.
Steve Dale referred to a company he would shortly be meeting, called HeadStart, which is using artificial intelligence and machine learning working on data (such as exam results, social media interventions) to identify candidates for organisations. They claim to shorten the time and lower the cost of getting the right people into the right jobs. He has been wondering how they would know what ‘a good result’ or ‘a bad result’ looks like…
David Haynes noted that the new data protection regulation will give people the right to challenge how decisions are made by automated systems, and to insist on human intervention if they don’t like the basis on which decisions are made.
Is it good to be averse to risk?
Anna Stothard asked for top tips or recommendations for changing a risk-averse culture, and getting more buy-in to new ideas from senior management.
David Smith remarked that government is keen on risk-aversion! Indeed the best way to get civil service management attention is to say, ‘If you want to avoid risk, do this.’ If he tells them about various benefits that a new approach could bring, he’ll be politely ignored. If he describes all sorts of bad things that could be avoided – then they are all ears (though one shouldn’t overdo it).
It all depends on your organisational culture; you need to assess management’s appetite for risk, and to make sure people understand the nature of the risks. He gave the example of a local government organisation that had turned down a Freedom of Information request on the grounds that it was ‘impertinent’, when what was underlying the response was a risk-averse culture.
Steve Dale said that in his consulting role he has had to go try to convince senior management that a change would be beneficial. His rule of thumb is to pay attention to Return on Investment (ROI); if the investment can be kept modest, the proposal is more likely to find favour.
Noeleen Schenk generally prefers to argue for change because of the benefits it will bring, but she had recently worked with a client where the concern was mostly about risk. So the project on which she was working was converted from a ‘value adding’ one to a ‘risk reduction’ one instead.
The role of knowledge organisation?
Keri Harrowven asked what role knowledge organisation plays in promoting knowledge and information management in the workplace.
Noeleen Schenk replied that, for Metataxis, knowledge organisation has a central role. But many people regard KO as an overhead, and an unnecessary expense. It takes time and effort to get KO right, but Noeleen will ask – ‘If you can’t find it, why have you got it?’ She recalled a client with about 110,000 boxes of documents in offsite storage, with next to no indexing, but they insisted they wanted to keep it all – at huge cost. She asked them, could they find anything? (No.)
Just because it is hard to do knowledge organisation, doesn’t mean that you shouldn’t. She’d say – start with some architecture, then build out. In a recent project, she has started by putting in place a set of requirements about how newly generated information is handled, first.
David Haynes noted that the UK Chapter of the International Society for Knowledge Organization often visits these topics. Like Noeleen, he thinks that there is no point in hoarding information if you can’t retrieve it. That leads to such KO questions as how you categorise information, how it is described, what metadata can be captured and attached, and what search and discovery tools you can put in place. It also goes into what the organisation’s needs are, what is the nature of the information you are faced with, and how you make that connection.
Also of increasing importance is how we can exploit information. Linked Data is an approach showing incredible potential, and new applications, such as combining map data with live sensor and update feeds – for example, the data revolution which helps Transport for London passengers know when their next bus is coming and where it is now. But none of these novel forms of exploitation would be possible without robust schemes for classifying and managing the information sources.
Finally, knowledge organisation is key to information governance.
Silos or outstations?
Someone asked: ‘Does having KM roles in an organisation create silos? How can move towards a more embedded approach?’
Karen MacFarlane described a hybrid approach in which her organisation had a central KIM team, which might be considered a silo; but she funded the placing of KIM professionals into teams of analysts for a year, helping them to develop their own information management skills. In every case, the teams that had had the benefit of working with the KIM professional wanted to find the funds to continue that work from within their own budgets.
Information governance directions?
Martin Newman wanted to know where panellists thought information governance was going, as the two initial speakers seemed to be predict new ways of working in which information roles would be decentralised.
David Haynes replied that KIM professionals are increasingly being tasked with data protection and information governance framework development. But he doesn’t think that they can work on their own. They have to work with the people on the legal side, and the people delivering the technology. It doesn’t really matter who is ‘in charge’, so long as there is that sort of coalition, and that it is embedded within the organisation.
Noeleen Schenk recounted noticing enormous variability in where information governance tasks are run from – sometimes from legal, sometimes from the executive, sometimes IT. Arguably, all is well if how people collaborate matters more to them than where people are sitting. She has been noticing a trend of information governance roles moving from the centre, along ‘spokes’, towards decentralised clusters of people; but it is even better if the way people work at every level supports good governance rather than it having to be done for them.
David Smith says that the culture of the civil service is already imbued with instinct to take good care of information. Yes, silos are there – he gave us a picture of ‘fifteen hundred silos in a single department, flying in close formation’. Teams have got smaller – to do with cuts, as much as anything else. Not every information asset is equally treated, depending upon risks attached. It’s a question of expedience, and balancing risk against cost.
His own department manages information about the European Regional Development Fund. If the European Court of Auditors asks to see information about any ERDF projects in the UK, his department has 72 hours to find it; or else there is a fine up to 10% of the value of the ERDF loan that financed that project. Imagine the prospect of a fine of £100,000 if you can’t find a file in 72 hours! You can bet the department has got that information rigorously indexed; whereas other areas are managed with a lighter touch, as they don’t carry the same risks.
There is also variability across government as to whether the work is done at the ‘hub’ or along the ‘spokes’.
Steve Dale pointed out that silos can exist for a reason – an example would be to maintain security in investment banking.
Globalism and process alignment
Emma Bahar had a question: ‘How can processes be managed in global organisations in which alignment is likely impossible?’
Steve Dale used to work for Reuters, with offices in every country. They managed very well in aligning their processes. Indeed, their whole business model relied on good interchange of quality information. He thought most global organisations would wither and die if there wasn’t good interchange and standardisation of processes. Yes, there will be cultural differences, and in Reuters they encountered these and learned to work with them.
Wikipedia again
David Penfold suggested returning to the question about the quality of information available on Wikipedia; are we asking too much looking for a perfect solution which doesn’t exist? Universities typically talk down Wikipedia, and students are not allowed to quote it as a reference. Is that realistic?
David Haynes pointed out that Wikipedia editing is moderated. A study some years ago compared the accuracy of Wikipedia articles against Encyclopaedia Brittanica online, and Wikipedia was found to be superior. He advises students that Wikipedia is a fantastic resource and they should use it – but not quote it! If Wikipedia gives a reference to a source document [according the Wikipedia ‘no original research’ rules, every assertion should be backed up by a citation], then go to that source and quote that. Wikipedia should be regarded as a secondary source, a good entry point into many subjects. Indeed, David uses it that way in his own research.
Noeleen Schenck hinted at possible double standards. In the analogue world we never relied on Encyclopaedia Brittanica for everything. She thought that some of the discomfiture was about how Wikipedia is authored by tens of thousands of volunteers. We should remember that enthusiastic amateurs helped to expand the boundaries of science; they are not necessarily ignorant or inept.
The panel agreed that Wikipedia should be regarded as one source amongst many. Noeleen compared this to reading several newspapers to get an angle on something in politics. How you assess sources brings us back to the topic of Information Literacy – not, perhaps, the best term for it, but as David Haynes confirmed, critical assessment of information sources is actually being taught (to KIM students, anyway).
Generational attitudes
Graham Robertson noted that Peter Thomson had talked about ‘millennials’ and their attitudes, and Graham wondered what the panel thought about the role the younger generations would play in changing attitudes, cultures and practices around KIM in organisations. Do younger people use and process information in a different way?
David Smith said he has been doing a review, where it was interesting to compare how older and younger people were sharing information within their cohorts. In the case of older members of staff, one could track discussions via email. But the younger staff members appeared to be absent. Why? It turned that they communicated with work colleagues using WhatsApp. Because it was a medium with which they were familiar, it was a quick way for them to ‘spin up’ a conversation. Of course, this poses new challenges for organisations. Discussions and information sharing are absent from the network (and apparently WhatsApp security isn’t up to much).
Noeleen Schenk thought it was a fool’s errand to try to force people to work in a way which they don’t find natural. She doesn’t know what the solution is, but we need to think afresh at important information and knowledge is kept track of – the current crop of tools seem inadequate.
Facing down ‘alternative facts’
Conrad Taylor asked: What is, or could be, the roles and responsibilities of all who work with knowledge and information – including teachers and journalists – in helping people to learn how to weigh evidence, distinguish fact from falsehood and propaganda, both in ‘big media’ and in social media?
David Haynes noted that this was increasingly a focus in meetings of KIM professionals [it was the subject of a panel session at the 2017 ISKO UK conference]. How can people be sure they are receiving unbiased information? Or if, like Steve Dale, we think that there cannot be unbiased information, we will have to be open to a range of information sources, as Noeleen had suggested.
David Penfold noted that in recent partisan political debate on social media, bots had been unleashed as disseminators of propaganda. Conrad noted that Dave Clarke of Synaptica has proposed a taxonomy of different sources of misleading information (see resources at https://davidclarke.blog/?page_id=16). The panel noted that the role being played by paid-for posts on, for example. Facebook and the way Facebook’s personalisation algorithms work are coming under closer strategy.
Conrad regretted that the term ‘Information and Knowledge Professional’ is often used to mean only people who curate information, excluding people whose job it is to create information – as writers, and designers and illustrators too. It is all too common to see data graphics that have been created in support of an editorial line, and which are misleading. (Indeed Steve Dale addressed this at a recent NetIKX meeting.)
Steve Dale remarked that we now have a new weapon to counteract ‘phishing’ attacks where fake online approaches are made in an attempt to defraud us of money, steal our identity, etc. It’s called Re:scam (https://www.rescam.org) and if you forward scammy emails to it, its artificial personalities will engage the scammers in an exchange of emails that will waste their time!
At this point, we ran out of time, but continued discussions over drinks. Face-to-face, naturally!

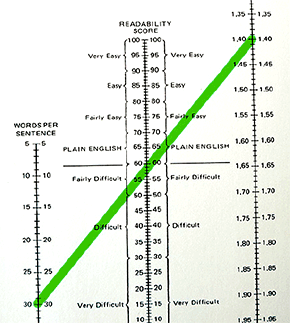 Flesch Readability Chart
 Ruth explained that she did not train to be a plain language communicator; she fell into it and found it a perfect match for her personality. Like many people who work on improving communication, she notices things that are odd or confusing in everyday life, and wonders how they could be organised better. She would describe herself as a Simplifier: someone who looks at information and thinks about how to make it easier for people to understand.