Human Capital – The Last Differentiator: Conrad Taylor writes

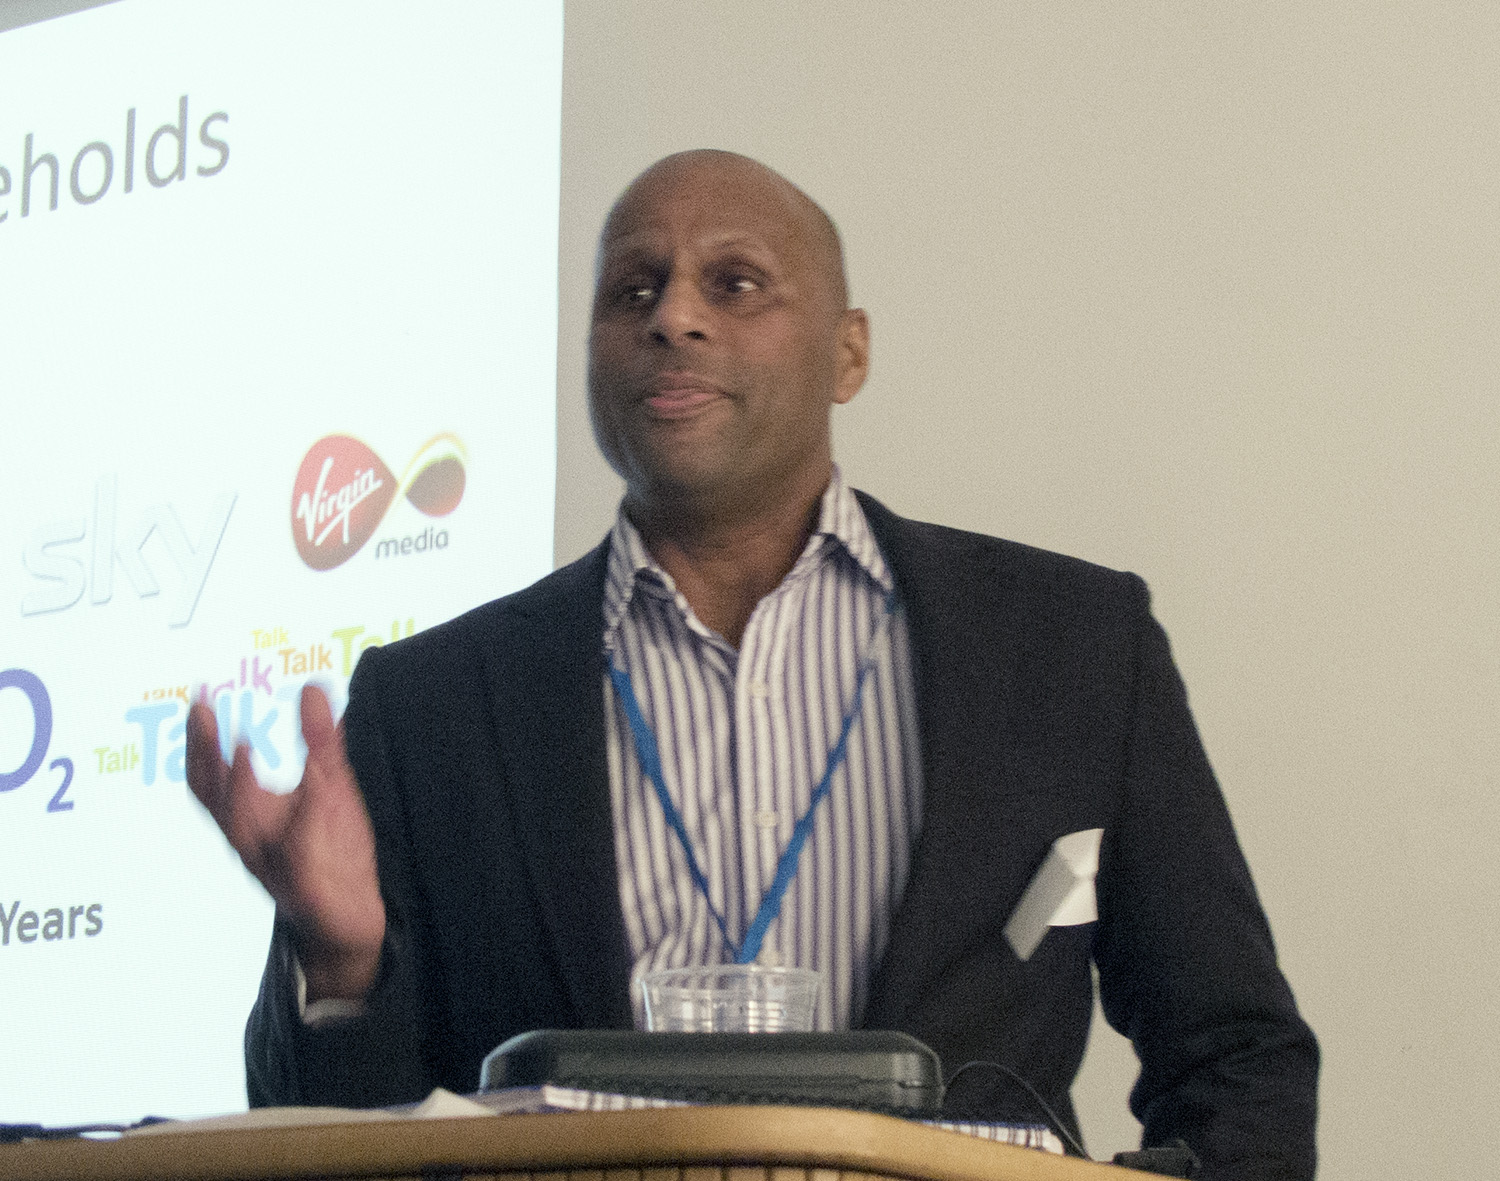
The speaker at this meeting was Rooven Pakkiri, who describes himself as helping business managers in organisations to use social media tools to further ‘Social Knowledge Management’.

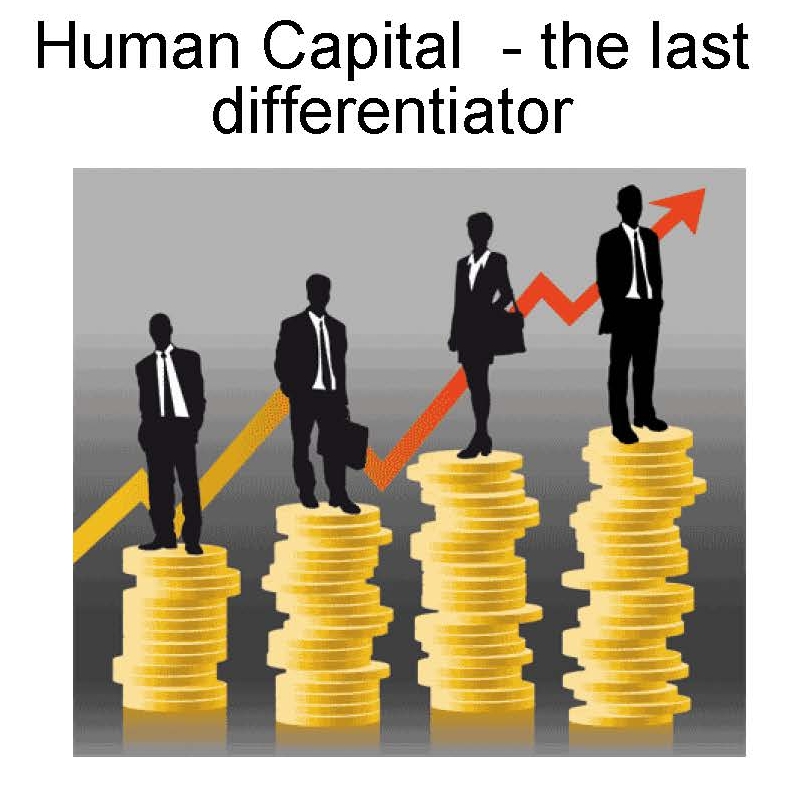
RoovenPakkiriWhen he was working for the National Westminster Bank in the late nineties, Rooven attended a training session introducing the Internet, which for him was a transformative experience. He concluded that, as this technology would ‘level the playing field’ between large and small organisations, the main differentiator between successful organisations and those less so, was how they made use of ‘human capital’.

For me this begs a few questions. For a start, what is human capital? I think that Rooven specifically equated it with knowledge and, to be more specific, with ‘intellectual knowledge’. This is probably truer in some business contexts than in others – and, of course, it’s an opinion well tailored to appeal to Knowledge Management types. However, there are fields of collective human endeavour where plenty of other human attributes contribute a great deal to the success of organisations – for example, empathy and kindness, loyalty, patience, attention, bravery, honesty and imagination.

It also seems clear that there are many kinds of organisation where the key to success is a very material form of capital, where, for example, you need money to invest in building plant, access to cheap electricity and perhaps political leverage, as well as hiring people with the requisite knowledge and skills.

Rooven asked us to recall when we first used Google. (Actually, I thought further back, to the ‘fast’ aggregated search facility on GeoNet, to Gopher and, when the Web came along, to Altavista and OpenText.) The reason we are able to find out so much online, he said, is because it is in human nature to want to share information.

He also set up a dichotomy between broadcast television and ‘the Internet’ (I think he meant the non-social-media side of the Web) on the one hand, and the likes of Facebook, Twitter and Instagram on the other. The first set he characterised as ‘broadcast media’, and rather old hat, and the latter group as made up of user-generated content.

I’m less inclined to see these as opposed; rather, each form has its strengths and weaknesses and we combine them in ways that work best for us. Many tweets and Facebook postings contain short-form URL links to blog posts, YouTube videos, online articles and other more considered forms of exposition.

There was some discussion about the degree to which people are prepared to share their knowledge, especially if their relative monopoly of it confers status and power. Rooven talked about some organisational practices, and technology deployments, which could be used to encourage people to share knowledge within their organisation, for example ‘reverse mentoring’, where a junior person shadows a more senior and more knowledgeable employee and writes blog posts representing the senior’s knowledge and insights.

There is an issue here about what kind of organisational culture encourages people to part with knowledge, the possession of which may well make them more secure in their position and less disposable. It reminded me of one of David Gurteen’s knowledge cafés at which someone from the HR department of a consultancy enthused about their knowledge sharing culture, while in discussions after, people from PWC said you’d be mad to give any advantage to your ‘colleagues’, who were always scrambling to climb over you to the top of the heap.

Then Rooven cited Deloitte as saying that, these days, employees have to be treated more like customers than subordinates. Again, I think that can only be true in certain organisations and work-roles. I see no evidence that the modern shop-worker, bus-driver, nurse, teacher or fast-food restaurant worker is treated with this sort of consideration.

Rooven’s next foray into knowledge transfer looked at the enhanced opportunities for self-directed learning which the Web gives us access to, for example videos on YouTube, TED talks and participation in online groups. I think Rooven’s view is largely that any sufficiently self-motivated person can, by dint of tracking down online training materials and doing a lot of study, succeed in learning anything. He spoke approvingly of Malcolm Gladwell’s assertion that 10,000 hours of study and practice can turn anyone into an expert. (This is from Gladwell’s book Outliers, which Steve Pinker has described as made up of ‘cherry-picked anecdotes, post-hoc sophistry and false dichotomies’; I certainly think that autodidacticism doesn’t suit everyone and that interpersonal knowledge transfer still has its place.)

What does it take to make knowledge transfer an ongoing phenomenon in an organisation? Rooven’s business is based on working with HR departments to get collaboration and knowledge sharing going, using network software platforms such as Yammer, Jive and Connections. Here I would have liked more use cases, though I guess Rooven is hampered by issues of confidentiality.

There is, however, some literature to draw on here, such as Julian Orr’s study of Xerox photocopier and printer repair technicians, and Etienne Wenger’s case study of staff at a medical insurance firm, which informs his book Communities of Practice. But this can fall flat, as seems to have been the fate of the Local Government Association’s Knowledge Hub.

Rooven suggested that people who act as ‘connectors’ between people and networks are amongst the most valuable people in companies. This is virtually identical to Wenger’s thoughts on the role such people play – he calls them ‘brokers’.

Towards the end of his talk, Rooven mentioned a computer game where the player has to put together a winning football team by choosing the best mix of players with different talents. He asked, what if companies similarly assessed the human capital attributes of their employees (and potential recruits) and put together ‘teams’ fitted to solve the important problems of the day? Here at least Rooven appeared to acknowledge that intellectual knowledge is only one of a number of desirable aspects of human capital.

I was less impressed by his suggestion that the business world should move towards a general ‘labour on demand’ model, shopping around in a skills marketplace and using short-term contracts to get jobs done. Doubtless that is the logic of capitalism, but it is a poor recipe for human security and development.

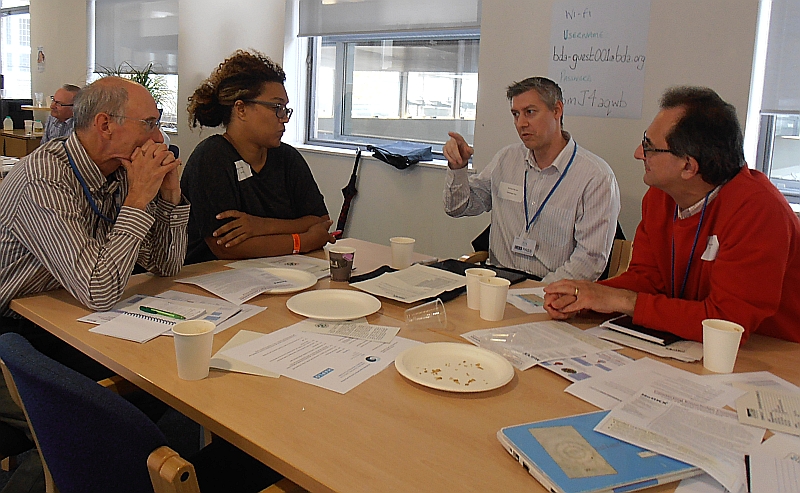
Rooven spoke for longer than is usual at a NetIKX meeting and, after the tea break, he offered to continue with a demonstration of some of the software platforms he uses, but we opted to stick with the NetIKX tradition of syndicate groups, of which there were three, each discussing a separate question.

I was in a group that discussed whether business is moving increasingly from the domain of the Complicated to that of the Complex. That is, is the world of business akin to the engine of a Ferrari, which a competent mechanic can disassemble, fix and reassemble? Or is it like the Brazilian rainforest, a complex ecology of interplaying organisms and factors, where not only is it impossible to know everything about the system, but you can’t even know what factors you don’t know about? (The ‘unknown unknowns.’)

Rooven said this was from an article in the Harvard Business Review: ‘A Leader’s Framework for Decision Making’ by Dave Snowden and Mary Boone. It appeared in November 2007 and you can find it here: https://hbr.org/2007/11/a-leaders-framework-for-decision-making. The article presents Snowden’s ‘Cynefin Framework’, in which a situation requiring decisions to be made is analysed as belonging to one of four possible Domains: Snowden labelled these as Simple (later changed to Obvious), Complicated, Complex and Chaotic. Rooven’s question focused on the middle two domains.

Although the basic either/or question was hardly worth discussing, we pushed the topic further. Organisations have a dynamic life in which some aspects are complicated, but rules have emerged to regulate them. Sometimes the organisation finds itself struggling with complexity where the dynamics are hard to figure out, but that’s not cause for despair. Snowden’s recommended response is to probe the situation by devising experiments that are ‘safe to fail’, and see which of these interventions move the situation in a desirable direction.

So, we had quite a lively syndicate session, even if the connection between the question we’d been posed and the topic of Human Capital was very loose.

I’d like to extend this topic towards other human attributes, and towards know-how and tacit knowledge, not just what organisations think they can squeeze out of employee’s brains.

Human Capital – The Last Differentiator: Lissi Corfield writes

Introduction

At our seminar on 19th January,  Rooven Pakkiri spoke about – “Human Capital – The Last Differentiator”. If you want to hear a recording of the talk, then you need to join NetIKX (www.netikx.org/). For another view on the meeting, see Conrad Taylor’s comments in the next post.

Human capital 1 croppedDoes our knowledge management work fit the model of Kew Gardens or Richmond Park?  Rooven Pakkiri picked his metaphors well!  This one provided two excellent images to highlight the different scenarios knowledge management might face in their places of work.  His slides were a powerful part of a very coherent look into the future of organisational knowledge management.  Feedback from those attending the seminar made clear that this had been a very enjoyable as well as valuable session.

Let’s start with some ideas that are already familiar to us all.

Knowledge Retention

How can an organisation tap the knowledge of experts so that it does not leave when they do.  He suggested ‘reverse mentoring’ where you pair a bright young employee with your elder expert, to blog about their ideas.  This is a bit more dynamic than than the rather sterile and late in the day ‘exit interview’.

Or how do we flesh out increasing training provision while enabling the organisation to become a learning organisation.  Rooven advocates the power of self directed learning, where the trainee can proactively use web resources to meet their needs at a pace and time to suit themselves.  Youtube and Ted talks were his favoured choices, but of course, this could be mixed with the ever increasing array of MOOC’s and other resources available on-line…

And the familiar issue of culture – do we as humans ‘like sharing’ or do we naturally withhold our knowledge to emphasise our own power.  I really appreciated his perspective on this, focusing on the sharing that goes on with social media to suggest that we have a strong instinct to share with our social groups.  If this does not happen at work, perhaps we should investigate the barriers to sharing that the workplace presents.  Where companies only reward individual performance in isolation from the wider team work, humans are likely to curb their sharing nature to play the system.  Changing the system then might be more appropriate than trying to dabble with ‘culture change’.

Human capital 3 croppedChallenges in the workplace

Rooven then moved into less familiar territory for knowledge managers.

How do we ‘manage’ information and knowledge flows between people when digital is changing so fast? Once BYOD (bring your own devices) flummoxed IT departments who wanted to control all the parts of the IT system.  Where do we stand when people have even more autonomy and BYOA takes over (bring your own applications)?  How will we, as information professionals cope with no control over any of the digital systems that staff are using within one office?  The advantages for staff themselves are very apparent though; as they work with the applications they enjoy using, rather than those enforced by the organisation.  But working out how to integrate the resulting communication and sharing links looks like chaos.  Will we cope?

Human capital 2 cropped

We considered the fate of numerous well-known brands that have been knocked out by digital change. One prime example was Blockbuster, a firm whose business model rose and fell within our own lifetime.  Netflix was their nemesis.  Rooven asked us to face these ‘Black Swans’, changes that can come out of the blue and disrupt business patterns entirely.  Again, it is easy to see the advantages – if you love opera and theatre and now can watch the best productions live streamed to your local cinema.  But we all have to be aware that ‘out of the blue’ amazing changes may affect our own patch of the world of work.

One more example that I found fascinating was the growth of gamification.  I had seen this as about rather crude reward systems based on kids’ games.  But Rooven introduced us to a key aspect of FIFA, the football game that has been popular for a few years now.  The key was not prizes and rewards, but the skill of building a cohesive team that would play together.  Clearly not a team of top stars – even someone who has no interest in football could see that this would be a team overloaded with prima donnas!  The football game player is encouraged to consider the way teams work and meld a team that will bring out the best in everyone.  Now that is a skill that clearly has resonance in our working lives.  So will people willing to take the roles of ‘lynchpin’ and facilitator become more vital than subject experts once so much knowledge can be accessed across the web.

Unknown Knowns and Known Unknowns

If we have looked at the unknown knowns and the known unknowns, the only place to finish was in the unknown unknowns!  The really scary stuff – or is it the really exciting place to be?  We talked about where knowledge and information professionals and librarians may be developing in the future.  As we know, the key knowledge resources are primarily in people’s heads, but with digital changes, are we now moving to a world where multi-faceted relationships brush aside organisational hierarchies?  Where knowledge management does not become easier or any less important, as it has to be ready to move with the unknown opportunities that will emerge.  We may be tending our internal glories, as Rooven modelled in his image of Kew Garden.  Or will we be looking at open systems, more on Richmond Park lines?  His talk left our heads reeling in a most stimulating way.  The images did look enticing (see http://www.slideshare.net/Rooven/icon-uk-2015)!

Questions for the delegates

Here are the three questions that Rooven set us to discuss in the seminar sessions:

  1. Did the group agree with Robin Dunbar’s assertion that humans can associate with a maximum of 150 people?
  2. Google allows us to know how to find something, rather than actually knowing anything – what are the implications for KM and Human Capital?
  3. Is it true that business is moving increasingly from the domain of the Complicated, to the domain of the Complex?

Questions for you

Three questions for members (and others) reading about this seminar:

  1. What changes to your work have unexpected digital revolutions caused?
  2. What ideas do you want to contribute relating to Rooven’s three seminar questions?
  3. Are there ideas here that you would like followed up in a future seminar?

We would be interested in your feedback.

Some relevant Tweets from Rooven

(See https://twitter.com/RoovenP – @RoovenP)

Power of social interaction…

3 Nov 2015: “More knowledge is created in social interaction than can ever be found in a database.” @grantgross http://www.cmswire.com/information-management/knowledge-management-grapples-with-agility-complexity/ … via @CMSWire

Self directed learning…

12 Nov 2015: Self directed learning – The L&D world is splitting in two http://www.c4lpt.co.uk/blog/2015/11/12/the-ld-world-is-splitting-in-two/ … via @C4LPT

A culture challenge!  

18 Dec 2015: imagine HR tagging indivduals and their content for 1 month – calculate the impact in terms of inclusiveness, culture shift and credibility

Offshoring/Outsourcing Information Services

Offshoring or Outsourcing your Information function – either, neither or both?  Whatever your situation the issues raised by this question are complex and fascinating.

Globalisation and the impact of the internet has changed so many aspects of our lives.  In this seminar on 19 November 2015, NetIKX members and guests looked at one important change that is now possible – relocating your information services team to far off places, or even outsourcing your information altogether to another organisation.

We had two lead speakers – Chrissy Street, now Head of Central Information Resources at Clifford Chance, and Karen Tulett, who is currently a Director at Morgan Stanley. In two presentations that revealed their long and impressive experience as information service leaders, they opened our eyes to the wide range of possibilities that is now available, and the pros and cons of different approaches.

The complexity of the situation was shown by the evolutionary paths taken by the companies as they look to get better research outputs for their money. At times, using employees with lower labour costs in different locations of the same company has proved good economic sense, but at other times, they have used the strategy of getting a separate provider to take on their information service needs.  Our speakers had experience of managing both types of change and Karen had even worked on the other side as a manager of an outsource providing company.

Outsourcing and offshoring were not simple alternatives to keeping work in the home office.  The companies concerned have both used an evolutionary approach. By using a ‘mix and match’ approach, they have been able to widen the range of options to suit their circumstances.  There were serious economies to be made from the best choices.

Much of the work has been focused in India, where a well-educated workforce is available to reduce costs. However, the companies have also continued to have a team in the UK.  Motivating staff was not a serious issue as in many ways, the new arrangement can be positive for all concerned.  Local staff continue to work on the higher value, more challenging work, while offshoring workers enjoy the opportunities offered by the routine work, as can be seen by the fact that some people have stayed with the company for over nine years.

Standards can be maintained by careful controls. If language is an issue as the workers are second-language English speakers, careful controls can be set up to monitor any problems. One important recommendation was to have a very robust quality control process. In addition, it is advisable to use a checklist to assess the suitability of a work task for offshoring and to ensure that there are no copyright compliance issues when information services tasks are taken offshore.

Further advantages were outlined.  Karen’s unit offers services almost 24/7 through a combination of onshore and offshore. Morgan Stanley has set up quick turnaround research unit this year, which shows that change keeps on happening!

At the end of the presentations, seminar groups discussed key issues raised.  These included the problems of setting standards for outsourcing or offshoring and the use of SLAs (service level agreements) and KPIs (key performance indicators), together with their advantages and disadvantages.  The group concerned considered that these could be straightjackets but also were necessary for distance controls.

Looking at changes facing information services, we move on to the next meeting to consider social knowledge management – how we keep ourselves employable while technology cuts a swathe through traditional ways of delivering services.

The meeting finished with a bubbly celebration for all attendees.  It was a powerful and joyful end to NetIKX’s three-year programme.

.

Connecting Knowledge Communities – 23 September 2015

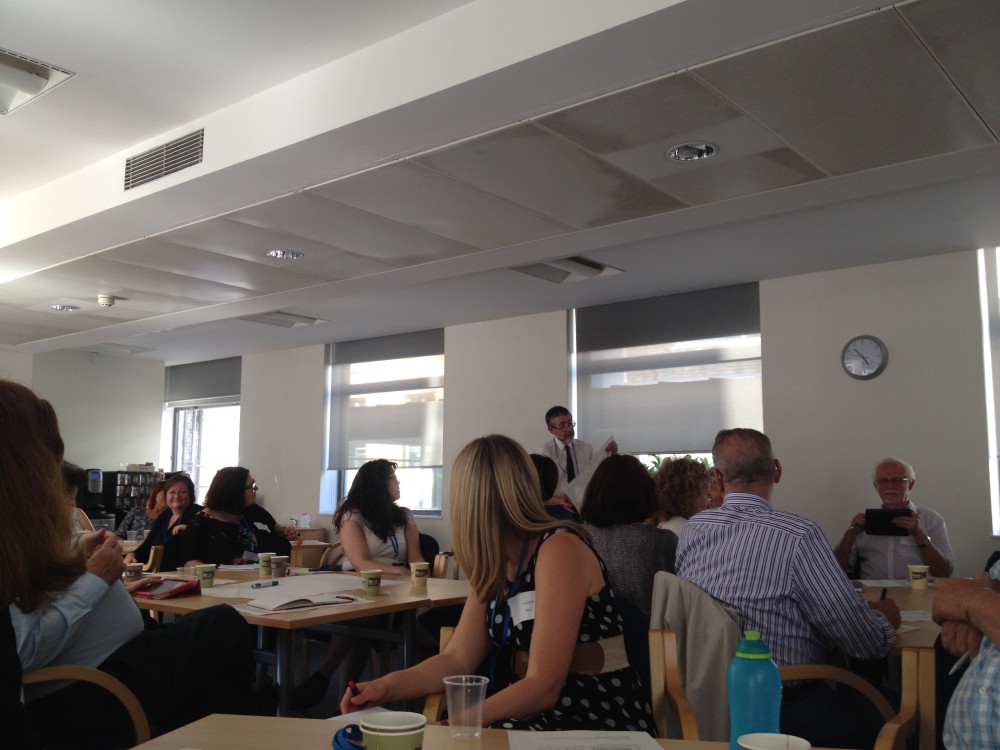
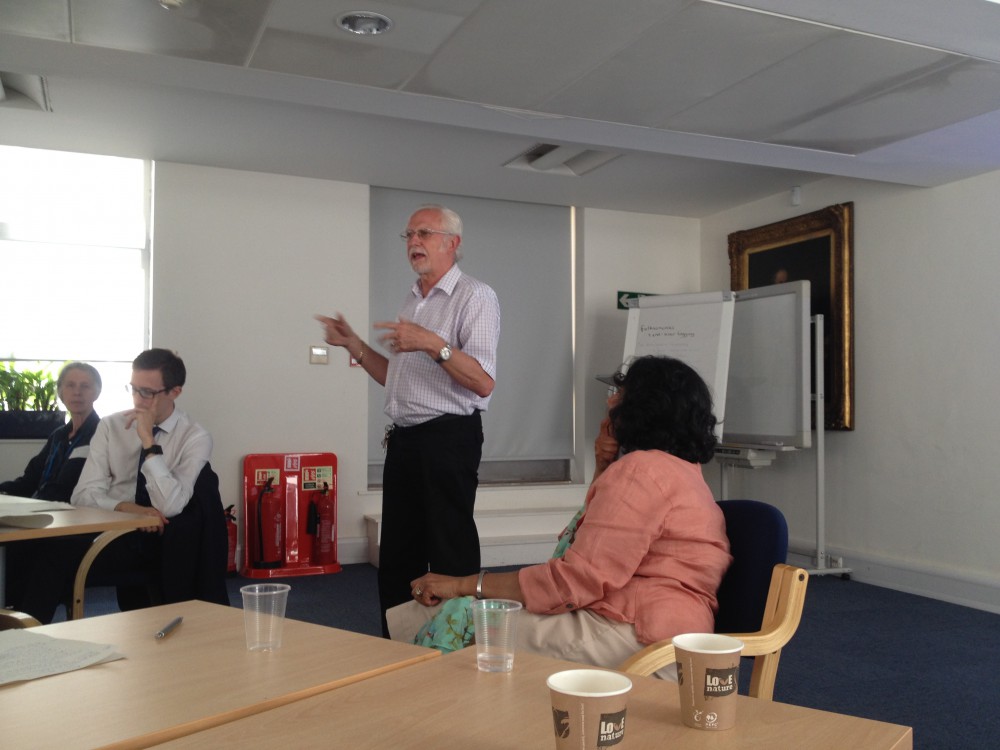
Syndicate session in progress

Syndicate session in progress

The aim of this meeting  was to bring together at least some of the UK communities concerned with knowledge and informatin management. These communities and organisations have different emphases, different modes of operation and even different approaches to membership. Some have regular meetings and a paid membership, while others are virtual and have no formal status or funds. Between these two extremes, there are many variants. In addition, different communities draw their members from different groups, both in terms of occupation and of industry.

NetIKX invited a range of such communities and organisations based in the UK, but mainly in London, to give short presentations on their genesis, membership and operation.

Communities that accepted this invitation and those who spoke on their behalf were:

Claire Parry spoke on behalf of NetIKX itself.

In addition, although not able to make a presentation at the meeting, David Gurteen and SLA Europe (the European Chapter of the Special Libraries Association) indicated that they were happy to support and be associated with the event. LIKE (London Information and Knowledge Exchange), CILIP and TFPL Connect-Ed also expressed interest in this initiative.

Each speaker described (in different ways) how their organisation came into being, how it operates and who its members are. The presentations, including one on NetIKX itself, were divided into pairs, each  followed by the usual NetIKX syndicate session, within which there was discussion of individual experience of networking groups and whether there is scope for these groups to collaborate and, if so, how it might be done.

While not leading directly to any future cooperation, this meeting provided a basis upon which there could be future developments. In the mean time, all those who attended have a better idea of the organisations that meet the needs of the knowledge and information communities and how they operate.

Hillsborough : Information Work and Helping People – July 21 2015

Jan Parry , CILIP’s President, gave a talk to NetIKX at the British Dental Association on the Hillsborough Disaster in 1989 and her role with the Hillsborough Independent Panel set up in 2009 to oversee the release of documents arising from the tragedy in which 96 people lost their lives at an FA Cup semi-final between Liverpool and Nottingham Forest held at Hillsborough, the home ground of Sheffield Wednesday FC. It was a very thought provoking talk which was received in near silence. Jan began by outlining the previous signals of potential disaster that had occurred in the 1980’s when serious ‘crushing’ incidents took place in the “pens” – standing areas in front of the West Stand accessed by gates on Lepping Lanes. She then talked about the day in question where Liverpool fans arrived late after being delayed by roadworks on the M62, traffic flowed along Leppings Lane until 38 minutes before the kick off and there was no managed queues at the turnstiles. The “pens”  were full 10 minutes before the match started. There was a lack of signs and stewarding to direct fans to other standing areas. At 3:00pm  crowds were still outside the turnstiles and the police Chief Superintendant in charge – who had been appointed to oversee policing on the day a little before the semi-final event itself –  gave an order to open the gates. There was a rush of fans towards the “pens” – people at the front were pushed forward, crushing and fatalities took place quickly. At 3:06pm the game was stopped. Then there was a Police Control Box Meeting at 3:15pm. The gymnasium became a temporary mortuary and witness statements started to be taken.

Official investigations began – Lord Justice Taylor (1990); West Midlands Police investigated South Yorks Police (1990); The Inquest (1990); Lord Justice Smith Scrutiny (1998). On the 20th anniversary memorial Andy Burnham (then a government minister) called for the early release of all documents. The Hillsborough Independent Panel was set up. Jan’s role was to undertake research and families disclosure :- oversee document discovery; manage information; consult the families. It began with finding family information – there were 3 established groups of families and all the other families as well.

There were lots of issues. Significantly, there had been a big impact on the mental health of the families involved in the tragedy. Also, regarding documents – that is, getting hold of them, it needed real persuasion to obtain them. Following on from that the documents had to be scanned, digitised, catalogued and redacted on a secure system. This called for researchers with medical knowledge too. What came out of this great exercise ?

In essence, the last valid safety certificate for the football stadium was issued in 1979; the code word for a “major incident” was never used; there was poor communication between ALL agencies; there was minimal medical treatment at the ground; witness statements had been changed; information on “The Sun’s” notorious leading article was obtained. Having achieved so much a disclosure day was put in the calendar – 12th September 2012. Again, the families were put first and informed that 41 victims could have lived.

On Disclosure Day itself PM David Cameron publicly apologised for the tragedy. The report was put on the website. Note that this website is a permanent archive for the documents : http://hillsborough.independent.gov.uk Disclosure had quite an impact – Sir Norman Bettinson (Chief Constable of South York at the time of the tragedy) resigned; the original inquests were quashed. Now there are new inquests and inquiries. Lord Justice Golding started a new Inquest in March 2014. There is an IPCC investigation and a Police investigation into misconduct or criminal behaviour by police officers post-tragedy. Coroners Rules 1984 have been tightened up regarding consistency of classes of documents. Police Force records have been put under legislative control. Crucially, for the families and Information Professionals records discovery and information management delivered the truth.

Jan showed a couple of video clips during her talk these are available from the Report pages online but you need to scroll down to the bottom of the page :

http://hillsborough.independent.gov.uk/report/main-section/part-1/page-4/

http://hillsborough.independent.gov.uk/report/main-section/part-1/page-7/


Rob Rosset


NetIKX meeting about Open Data (14th May 2015)

Open Data

Write-up by Conrad Taylor (rapporteur)

The May 2015 meeting of the Network for Information and Knowledge
Exchange took Open Data as its subject. There was a smaller crowd than
usual, about 15 people in total, and rather than splitting into table
discussion groups halfway, as NetIKX meetings usually do, we kept
together for one extended conversation of about two and a half hours,
with Q&A sprinkled throughout.

The meeting had been organised by Steve Dale, who also chaired. As
first speaker he had invited Mark Braggins, whom he had met while
working on the Local Government Association’s Knowledge Hub project.
Mark was on the advisory board for that project, having previously
played a role in setting up the Hampshire Hub, which he later
described. Mark’s co-speaker was  Steven Flower, an independent
consultant in Open Data applications with experience of the technical
implementations of Open Data.

The slide sets for the meeting can be found HERE and HERE

Introducing Open Data

Mark started with an introduction to and definition of Open Data:
briefly put, it is data that has been made publicly available in a
suitable form, and with permissions, so that anyone can freely use it
and re-use it, for any purpose, at no cost; the only constraint is
that usually the licence requires the user to acknowledge and
attribute the source of the data.

Tim Berners-Lee, the inventor the the Web, has suggested a five-star
categorisation scheme for Open Data, which is explained at the Web
site http://5stardata.info. The lowest level, deserving one star, is
when you make your data available on the Web in any format, under an
open licence; it could be in a PDF document for example, or even a Web
graphic, and it needs a human to interpret it. You can claim two stars
if the data is put online in a structured form, for example in an
Excel spreadsheet, and three stars if the data is structured but also
in a non-proprietary format, such as a CSV file.

If your data is structured as a bunch of entities, each of which has a
Uniform Resource Indicator (URI) so it can be independently referenced
over the Internet, you deserve a fourth star, and if you then link
your data to other data sources, creating Open Linked Data, you can
claim that fifth star.

Steve Flower came in at this point and explained that his experience
is that most organisations who are going down the Open Data road are
at the three-star level. Moving further along requires some technical
knowledge, expertise and resource.

Mark displayed for us a list of organisations which publish Open Data,
and some of them are really large. The World Bank is a leader in this
(see http://data.worldbank.org). The UK Government’s datastore is at
http://data.gov.uk, and that references data published by a wide
variety of organisations. Some local government authorities publish
open data: London has the London Data Store, Bristol has Open Data
Bristol, Manchester has Open GM, Birmingham has its Data Factory,
Hampshire has its Hub and the London Borough of Lambeth has Lambeth in
Numbers. A good ‘five star’ example is the Open Data Communities
resource of the Department for Communities and Local Government
(DCLG).

Asked how the notion of Open Data relates to copyright, Mark explained
that essential to data having Open status is that it must be made
available with a licence which explicitly bestows those re-use rights.
In the UK, for government data, the relevant license is usually the
Open Government License, OGL. Other organisations often use a Creative
Commons license.

A key driver for national government departments, and local government
too, to get involved in the world of Open Data is that these bodies
now operate under an obligation to be transparent, for example local
government bodies are obliged to publish data about each item of
expenditure over £500 and about contracts they have awarded. Similar
requirements are driving Open Data also in the USA.

Mark recommended that anyone with an interest in Open Data must take a
look at the Web site of Owen Boswarva (http://www.owenboswarva.com/)
which has a number of demo examples of maps driven by Open Data.

I asked if the speakers knew of example of Open Data in the sciences.
Steven said that in the Open Data Manchester meetings which he
organises, they had had an interesting talk from a Manchester academic, Prof Carole Goble about experimental data being made available ‘openly’ in support of a
transparent scientific process and reproduceability. (Open Data is one of the ‘legs’ of a wider project dubbed Open Science, in which one publishes not only conclusions but also experimental data.)

Some Examples

Mark then illustrated how Open Data works and what benefits it can
bring with a number of examples. His first example was a map
visualisation based on a variety of data sources, which was
constructed for the Mayor of Trafford to discover where it would make
most sense to locate some extra defibrillators in the community. A mix
of data sources, some open and some closed, were tapped to inform the
decision making: population densities, venue footfall, age profiles,
venues with first-aiders on the staff, ambulance call-out data.
Happily, there is now real proof that the defibrillators which were
distributed be means of this evidence have been used and have
undoubtedly saved lives.

Mark’s second example was from Hampshire. A company called Nquiring
Minds has taken Open Data from a variety of sources, and used a
utility to construct an interactive map illustrating predictions of
the pressure from users on GP surgeries, looking forward year by year
to the year 2020. You can see this map and interact with it by going
to http://gpmap.ubiapps.com. This kind of application can inform
public policy debates and planning. (incidentally, that project was
funded by Innovate UK, the former Technology Strategy Board).

Steven described another health-and-location-data project which
gathered together statistics about the prescribing of statin
medication by GPs, in particular looking at where big-name-pharma
branded statins were being prescribed, at some considerable expense to
the NHS and public purse, compared to surgeries where cheaper generic
statins were being prescribed.

Another example was about a database system whereby universities can
share specialised scientific equipment with each other. (Take a look
at this at http://equipment.data.ac.uk.) The project was funded by
EPSRC. Of course it was important that the participating institutions
agreed a standard for which data should be shared (what fields, what
units of measure etc); and establishing this standard was perhaps the
most time-consuming part of getting the scheme going.

A very attractive example shown was the global Wind Map created by
Cameron Beccario. Using publicly available earth observation and
meteorological data from a variety of sources, and using a JavaScript
library called D3 (http://d3js.org), he has constructed a Web site
that in its initial appearance animates a display of wind direction
and velocity in animated form for everywhere in the world.

The Wind Map site is at http://earth.nullschool.net and it is worth
looking at. You can spin the globe around and if you sample a point on
the surface you will get a readout of latitude, longitude, wind speed
and direction. In fact it’s more than a wind map because you can also
switch to view other forms of data such as ocean currents, temperature
and humidity for either atmosphere or ocean, and you can change from
the default rotatable globe to a variety of map projections. While you
are there you can see what data source is being accessed for each
display. (Thanks to a minimalist interface design this is not at all
obvious but if you click on the word ‘earth’ a control menu will
reveal itself.)

About the Hampshire Hub

Mark then turned to the example closest to his heart, the Hampshire
Hub (http://www.hampshirehub.net). This is a collaboration between 22
partnering organisations, including the County Council, three unitary
authorities and 11 district councils, the Ordnance Survey, the police
and fire services, the Department for Communities and Local
Government, the British Army and two national parks. A lot of the data
is ‘five-star’ quality. That’s not true of all the sources, for
example Portsmouth health data is posted as Excel spreadsheets, but
there is an ongoing process over time to try to turn as much as is
practical into Linked Open Data.

Together with these data components, the Hub site also hosts articles,
news, tweets etc. and other kinds of ‘softer’ and contextual
information.

The site gives access to Area Profiles, which are automatically
generated from the data, with charts from which one can drill down to
the original datasets.

Building new projects around the Hampshire Hub

Around these original data resources, new initiatives are popping up
to both build on the datasets and contribute back to the ecosystem
with an open licence. An example which Mark displayed is the Flood
Event Model, which combines historical data with current environmental
conditions to attempt predictions of which places might be most at
risk from a severe weather event. It has taken quite a bit of effort
to use historical data to elicit hypotheses about chains of causation,
then re-test those against other more recent datasets, and as new
datasets can be linked into such as from the Met Office and the
Environment Agency, a really useful tool can emerge. And this could
have very practical benefits for advising the public and planning
emergency response.

Another example project is Landscape Watch Hampshire, which is sharing
a rather complex type of data: aerial photography from 2005 and 2013.
To compare these with the aim of documenting changes to the landscape
and its use really requires humans, so the plan of Hampshire’s
collaboration with the University of Portsmouth and Remote Sensing
Applications Consultants Ltd is to crowdsource analytical input from
the public. This is explained in more detail at
http://www.hampshirehub.net/initiatives/crowdsourcing-landscape-change.

Another initiative around the Hampshire Hub is to link open data
around planning applications. There is a major problem in keeping tabs
of planning applications because they are lodged with many different
planning authorities and in ways that don’t inter-operate, and if your
area is on the border between planning jurisdictions, it’s all the
more problematic. And this despite the fact that for example the
building of a hypermarket or the siting of a bypass has effects which
radiate for dozens of miles around.

Hampshire has taken the lead together with neighbour Surrey but also
with Manchester to determine what might be an appropriate standard
form in which planning data could be exported to be shared as Open
Data. The Open Data User Group (a ministerial advisory body to the
Cabinet Office) is building on this work.

Mark finished his part of the presentation by mentioning the Open
Data Camp event in Winchester, 21–22 February 2015 (including Open
Data Day). Over 100 people attended this first UK conference on Open
Data which he described as ‘super fun’. See http://www.odcamp.org.uk
where there are many stories and blogposts about the event and the
varied interests of participants in Open Data. Similar ‘camps’ coming
up are BlueLightCamp (Birmingham, 6–7 June), LocalGovCamp, UKGovCamp
and GovCamp Cymru.

The Open Data Ecosystem

Steven Flower spoke for a shorter time, and structured his talk around
the past, the present and our future relationship to Data; slightly
separately, the business of being Open; and the whole ecosystem that
Open Data works within. Steven is an independent consultant helping
organisations with implementing Open Data, many of then
non-governmental aid organisations, and indeed that morning he had had
a meeting with WaterAid.

When Steven has conversations with groups in organisations about their
data and how and why they want to make it ‘open’, often various kinds
of diagram are resorted to in order to articulate their ideas. Mostly
these are ‘network diagrams’, boxes and arrows, blobs joined by lines,
entities and their interrelationships. Sometimes the connected blobs
are machines, sometimes they are data entities, sometimes they are
people or departments.

In New York City their diagrams (which are quite pretty) show
‘islands’ or more properly floating clusters of datasets, mostly
tightly gathered around city functions such as transport, education,
the police; with other datasets being tethered ‘offshore’ and some
tied up to two or three such clusters. Some diagramming focuses more
on the drivers behind Open Data projects, and the kinds of people they
are meant to serve.

Past and present attitudes to data

Steven took us back with a few slides to the days when there were few
computers, and later when there were just 25 million Web pages. Now
the Internet has mushroomed almost beyond comprehension of its scope.
Perhaps when it comes to Open Data, we are still in ‘the early days’.
And data is something we are just not comfortable with. We struggle to
manage it, to exercise governance and security over it. We can’t
easily get our heads around it, it seems so abstract.

It seems that big companies get data, and they get Big Data. Tesco
aggregates, segregates and analyses its customers’ shopping
preferences through its Clubcard scheme. Spotify has been buying
companies such as The Echo Nest, whose software can help them analyse
what customers listen to, and might want to listen to next.

More and more people carry a ‘smartphone’, and these are not only the
means to access data: we continuously leak data whether deliberately
in the form of tweets, or unconsciously as GPS notes where we are.
People increasingly wear devices such as the FitBit which monitor our
personal health data. Sensors in people’s homes, smoke alarms and
security cameras for example, are being hooked up to the Internet
(‘the Internet of Things’) so they can communicate with us when they
are out.

People and organisations also worry about the ‘Open’ bit. Does it mean
we lose control of our personal data profile? If there is an
uncomfortableness about Open Data, why might we want to do this?

As an object to think about Steven offered us Mount Everest. It is
8,850 metres high (that is data). Digging deeper, Everest has a rich
set of attributes. Under the surface there is a complex geology, and
it is being pushed up by tectonic plate movements. Recently, one of
those movements resulted in an earthquake and thousands of deaths. To
help in this situation have come a number of volunteers from the Open
Streetmap community, who are working collaboratively to fill in the
gaps in mapping, something which can greatly benefit interventions in
disasters (the same community helped out during the Haiti earthquake).
Given a defined framework for location data, the task can be split up
into jobs, farmed out to volunteer teams and collected in a database.

Turning to his personal experience of Open Data projects, Steven gave
us a view of ‘past, present and future’. Around 2007, he was involved
in setting up a service called ‘Plings’ (places to go, things to do)
which merged data from various sources into a system so that young
people could find activities.

Moving to the present, Steven touched on a number of Open Data
projects with which he is involved. WaterAid is one of a number of
charities which believes strongly in transparency about how it works,
how it spends funds and so on. They are involved in an project called
the International Aid Transparency Initiative, which is building a
standard for sharing data about aid programmes. He showed us a
screenful of data about a WaterAid project in Nepal, structured in
XML.

Published as Open Data, this information can then be accessed and used
in a number of ways. Some of this is internal to the organisation so
they can make better sense of what they are doing, but because it is
Open Data it can also be visualised externally, and Steven showed us
some screens from the Development Portal (http://d-portal.org),
displaying IATI data sourced from WaterAid.

As data on situations requiring overseas aid and disaster
interventions is shared more transparently, it should become more
possible for use data as the basis of better aid delivery decisions.

The future generation, the future view

And what of the future? Well, in Steven’s immediate future, just a few
days ahead, he said he would be working with a group of schoolchildren
in Stockport, who have ‘Smart Citizen’ miniature computers in their
school, based on an Arduino board with an ‘Urban Shield’ board
attached. The sensors on this apparatus harvest data about
temperature, humidity, nitrous oxide and carbon monoxide emissions,
light and noise, and their data is uploaded and shared on the Smart
Citizen Web site (https://smartcitizen.me/). Thus the school is
joining a worldwide project with over a thousand deployed devices.

I personally know of a very similar project in South Lambeth, where a
school is collaborating with a school science project called Loop Labs
founded by Nicky Gavron, a member of the London Assembly. The Lambeth
project differs in a number of respects: it is focused only on the air
quality data, but rather that having a single sensor in the classroom
they have a number of ‘air quality egg’ sensors deployed to the
children’s homes to get local comparison data. Also, the Loop Labs
project is strongly linked to environmental health issues.

Where the Salford schools project looks like being really
adventurously pioneering is in the ways they aim to use the data
harvest locally. Spreadsheets is one option, but how cool are they?
Steven hope that the data can be sucked into the Minecraft environment
for building virtual items assembled from blocks, and maybe data
patterns can be made audible by transforming the values captured into
the code that programs the Sonic Pi music synthesiser software for
Raspberry Pi, Mac OS X and Windows (Google that, download the code and
play with it — great fun!).

The schoolkids have also used 3D printing to create a small fleet of
Cannybots — or rather, as I understand it, what you 3D print is a kind
of Airfix kit for the casing and then you install a small circuit
board with an ARM processor on it, plus Bluetooth communication for
control (see http://cannybots.com/overview.html). The next step will
be to use the data from their Citizen Science sensor to drive patterns
of behaviour in the mini robots. There is no guarantee that this will
work, but that is the nature of the future!

What does an Ecosystem need?

To be healthy, any ecosystem for Open Data absolutely require
standards, and the IATI standard is an example of that in action.
Steven is also working on a standard for a project called 360 Giving
(http://threesixtygiving.org/), which is a movement that encourages UK
grant makers and philanthropists to publish their grant information
online. It is a small beginning but currently 14 grant makers are
participating.

Steven’s also working on the international Open Contracting data
standard (http://standard.open-contracting.org/), where the Open Data
publishing pioneers are the Colombian and Mexican governments. With an
estimated US$9.5 trillion being spent every year on government
contracts, transparency in this area could help to hem in and expose
corruption and mismanagement.

A healthy Open Data ecosystem also requires feedback loops, and for
Open Data these should be super-responsive. The Citizens Advice Bureau
in the UK does this well; Steven showed us one of their Web pages
which in near real time shows which are the main topics people are
searching on from the CAB.

Finally, a healthy Open Data ecosystem needs the engagement of people.
At the moment, the Open Data system does tend to look like this: young
men, at a weekend, gathered around laptops and with pizza. What the
scene needs is greater diversity. That is one reason that Steven is
involved in the Manchester CoderDojo project, which monthly gathers
large numbers of young people to engage with coding and data. You can
find out more about that here: http://mcrcoderdojo.org.uk/ Five years
ago, the average participant was age 15; now, it is age 10!

In discussion: where does the data come from?

One of our number (Stuart) said that in the presentations, almost all
of the ‘supply’ side had come from the public sector (or NGOs). What
was the private sector contributing? Mark said that this is generally
true; but the UK Department for International Development (DfID) now
require all of their international contractors to publish IATI open
data about their contract work: the contracting firm Capita is a case
in point.

The Open Contracting programme is also interesting here, and the
biggest driver in that is the World Bank, plus very large contracting
organisations such as IBM who think they will benefit from
transparency.

In discussion: Open and Big Data

Graham Robertson wondered what intersect there was between Open Data
and Big Data. Steven said that personally he works with organisations
publishing small datasets, but through their openness they do connect
into something larger. Steve Dale thought that ‘Big Data’ has a
meaning that is hard to pin down; one organisation’s Big might be
another’s Small.

Graham wondered if the huge volumes of data now processed in weather
forecasting provide an example of Big Data. I think they do, and even
larger volumes are processed in the supercomputers of the Hadley
Centre for Climate Change which is co-located in Exeter. Developing,
testing and running climate change prediction models also benefits
increasingly for Open Data, as nearly 90 countries and as many
international organisations now share sensor data and observations
from platforms from the ocean bed to outer space, through GEOSS (the
Global Earth Observation System of Systems).

In discussion: privacy issues

We did along the way have a discussion about the interrelation between
the openness of data, and the privacy of individuals on whom that data
is based: health data being a particularly sensitive case. To what
extent can data really be anonymised, when location information is
also implicated, or anything else which might identify a data subject?
I described some recent voluntary work for Tollgate Lodge Health
Centre in Stoke Newington, in which I examined demographics data from
the Census about family size and age profiles of the population in
Hackney. At a Borough level, age data can be obtained at single-year
granularity; at Ward level, the population is aggregated into age
bands; and the bands are even coarser ond more aggregated if
geographically you go down to Super Output Areas.

Steve came up with an example of how Open Data about taxi journeys in
New York had been collated by someone with tweets by celebrities about
their taxi journeys, leading to the possibility of figuring who had
made what journeys. It’s worth remembering that potentially we are
shedding flakes of data all the time, like dandruff.

In discussion: a skill gap?

From his experience of the data sector in Manchester, Steven said that
business complains that they can’t find people with the relevant
skills, and why can the schools address this better? But on the other
hand, industry is also unclear about what skills it will need in five
years’ time. Perhaps we would do well to think about ‘data literacy’,
and he feels pretty sure that the kids with whom he was about to start
working might not know how to interpret a graph or a data map.

Steve Dale referred back to the previous NetIKX meeting (see blog post
here: https://netikx.wordpress.com/2015/03/23/seek-and-you-will-find-wednesday-18th-march-2015/)
and observations made by the speaker Tony Hirst. Tony has said that
people these days tend to trust too much in algorithms without asking
what it does or who made it; from that it follows that excessive trust
is placed in the output of those algorithms. The pre-election
predictions of the pollster algorithms certainly went wrong!

Stuart Ward (Forward Consulting) thought that driving Open Data and
gaining organisational advantage from it, requires information
officers to be encouraged to be pro-active in contacting their peers
in other organisations, actively looking for opportunities to
collaborate (as indeed does seem to have been happening in local
government).

Steven reported on an interesting collaboration between WaterAid and
JPMorgan. The latter has an undergraduate programme to find the best
talent and recruit them, and they set these people to work on
WaterAid’s open data, e.g. to produce visualisations; thus they could
spot the best people to employ in their business.

In discussion: miscellaneous thoughts

As for me, I wondered if too great a concentration on the value of
data in research might have the unfortunate effect of further
sidelining qualitative forms of enquiry in the social sciences and in
knowledge management. Both forms of enquiry have their value, and it
is interesting to note approaches which link narrative enquiry to
big-data scale, as is possible using Cognitive Edge’s SenseMaker
software and methods (See explanation by Dave Snowden at
http://www.sensemaker-suite.com/)

How well is the UK placed in a ‘league table’ of countries doing Open
Data? Our speakers thought pretty much at the top, followed by the
USA; Steve Dale though France had claimed the lead. The 2014 index
maintained by the Open Knowledge Foundation, for what it is worth,
ranks UK first at ‘97% open’, France third at 80%, and the USA in
eighth place at 70% open (see http://index.okfn.org/place/).

In Britain there has been an interesting history of struggle over
barriers that haven’t been present in the USA: for example, their
postcode data has always been open-access, whereas it took a bit of a
battle to get Royal Mail to open it up. People who want to know more
about the history and status of address data in the UK would do well
to read the report and listen to the MP3 podcasts from the recent
‘Address Day’ conference organised by the BCS Location Information
Specialist Group.

Twitter

A certain amount of tweeting was done through the afternoon — the
hashtag was #netikx73
Seek and you will find? Wednesday 18th March 2015

We had two excellent speakers for our Seminar on 18th March, entitled “Search and you will find?” Karen Blakeman and Tony Hirst. The question mark in the title was deliberate, since the underlying message was that search and discovery might sometimes throw up the unexpected.

Learning objectives for the day were:

  • To understand the commercial, social and regulatory influences that have (or will) influence Google search engine results.
  • To be able to apply new search behaviours that will improve accuracy and relevance of search results.
  • An appreciation of data mining and data discovery techniques and the risks involved in using them, as well as the education and skills required for their disciplined and ethical use

Karen Blakeman delivered an informative and thought-provoking talk about our possibly misplaced reliance on Google search results. She discussed how Google is undergoing major changes in the way it analyses our searches and presents results, which are influenced by what we’ve searched for previously and information pulled from our social media circles. She also covered how EU regulations are dictating what the likes of Google can and cannot display in their results.

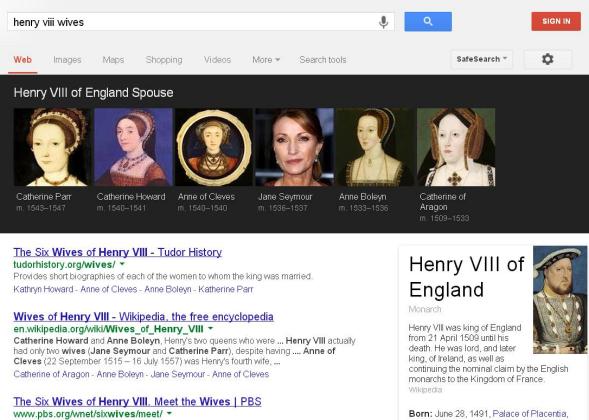
Amongst many examples that Karen gave of imperfect search results, this one of Henry VIII’s wives stood out – note the image of Jane Seymour, where Google has sourced the image of the actress Jane Seymour.

Blog image re Jane Seymour

This is an obvious and easily spotted error, others are far subtler, and probably go unnoticed by the vast majority of search users. The problem, as Karen explained, is that Google does not always provide attribution for where it is sourcing its results, and where attribution is provided, the user must (or should) decide whether this is a reliable or authoritative source. Users beware if searching for medical or allergy symptoms; the sources can be arbitrary and not necessarily from authoritative medical websites. It would appear that Google’s algorithms decide what is scientific fact and what is aggregated opinion!

The clear message was to use Google as a filter to point us to likely answers to our queries, but to apply more detailed analysis of the search results before assuming the information is correct.

Karen’s slides are available at:  http://www.rba.co.uk/as/

Tony Hirst gave us an introduction into the world of data analytics and data visualisation and challenges of abstracting meaning from large datasets. Techniques such as data mining and knowledge discovery in databases (KDD) use machine learning and powerful statistics to help us discover new insights from ever-larger datasets. Tony gave us an insight into some of the analytical techniques and the risks associated with using them. In particular, if we leave decision making up to machines and the algorithms inside them, are we introducing new forms of bias that human decision makers might avoid? What do we, as practitioners need to know in order to use these tools in a responsible way?

As Tony explained, the most effective data analysis comes down to discovering relationships and patterns that would otherwise be missed by looking at just one dataset in isolation, or analysing data in ranked lists.  Multifaceted data analysis, using – for example – datasets applied to maps, can give unique visualisations and more insightful sense making.

Amongst many other techniques, Tony discussed Concordance Correlation, Lexical Dispersion, Partial (Fuzzy) String Matching and Anscombe’s Quartet.

Tony’s slides will be available at: http://www.slideshare.net/psychemedia

Following the keynote presentations from Karen and Tony, the following questions were put to the delegates:

  • How can organisations ensure their staff is using (external) search engines effectively?
  • How do you determine the value of search in terms of accuracy, time, and cost?
  • If I wanted to know how to use data visualisation and data analysis tools, where do I go? Who do I ask?


The delegates moved into three groups to discuss and respond to these questions (one group per question). The plenary feedback as follows:

Group 1 – How can organisations ensure their staff is using (external) search engines effectively?

  • Ban them from using Google
  • More training
  • Employ specialists to do research
  • Use subscription services
  • Change the educations system.

Group 2 – How do you determine the value of search in terms of accuracy, time, and cost?

  • Cost and Time are variable
  • Accuracy is the most important criterion
  • Differentiate between “value” and “cost”

Group 3 – If I wanted to know how to use data visualisation and data analysis tools, where do I go? Who do I ask?

Lastly, we’d like to thank our speakers and the delegates for making this such an interesting, educational and engaging seminar.

Karen Blakeman (@karenblakeman) is an independent consultant providing a wide range of organisations with training, help and advice on how to search more effectively, how to use social and collaborative tools for research, and how to assess and manage information. Prior to setting up her own company Karen worked in the pharmaceutical and healthcare industry, and for the international management consultancy group Strategic Planning Associates. Her website is at www.rba.co.uk <http://www.rba.co.uk/> and her blog at www.rba.co.uk/wordpress/<http://www.rba.co.uk/wordpress/>.

Tony Hirst (@psychemedia) is a lecturer in the Department of Computing and Communications at the Open University, where he has authored course material on Artificial Intelligence and Robotics, Information Skills, Data Analysis and Visualisation, and a Data Storyteller with the Open Knowledge School of Data. An open data advocate and Formula One data junkie, he blogs regularly on matters relating to social network analysis, data visualisation, open education and open data policy at blog.ouseful.info

Steve Dale
20/03/15


Business Information Review is seeking a new editor

Business Information Review is seeking a new editor to replace Val Skelton and Sandra Ward from the end of March/Early April next Year. They will have completed five years of editing by then – and they think it’s time to hand over what is fun, exciting and challenging! Due to the decision of Val Skelton and Sandra Ward to complete their joint editorship of Business Information Review in March/April 2015, Sage Publications would like to find replacement editor(s). Val and Sandra have job shared the editorship. Details of the post, which is remunerated, and how to apply for it can be found at : http://bir.sagepub.com/site/includefiles/BIR%20Call%20for%20Editor%28s%29.pdf

Val and Sandra are happy to answer queries about the post. Contact :


Communities of Practice for the Post Recession Environment Tuesday 16th September 2014

35 people attended this Event at the British Dental Association in Wimpole Street. Our speaker was Dion Lindsay of Dion Lindsay Consulting : http://www.linkedin.com/pub/dion-lindsay/3/832/920 . Dion tackled big questions in his presentation. Are the principles established for successful Communities of Practice (CoP’s) in the 1990’s and earlier still sound today ? AND what new principles and good practices are emerging as social media and other channels of communication become part of the operational infrastructure that we all inhabit ? Dion started of with a couple of definitions. He explained the characteristics of CoP’s. In essence it begins with ‘practice’. Practitioners who discuss and post about practical problems. Practitioners who suggest solutions and develop practice. These solutions are at the practical level. Hence, competence at individual and corporate level is increased.  It continues with collaboration – the development of competence in an environment short of money ! He instanced the Motor Neurone Disease Association (MNDA) where he had developed an electronic discussion board in the 1990’s. In 1998 this electronic discussion board was taken over by University College London (UCL) and became an electronic discussion forum. It had cumulated 40,0000 posts. An analysis showed that the forum splits 80% moral support and 20% problem solving in terms of posts.

How about Communities of Interest (CoI’s) ? These are all about people who share an identity. They have a shared voice and conduct a shared activity. So ‘identity’ is a critical characteristic Also, there is an ongoing discussion about interests, an ongoing organisation of events and an interest in problems and solutions. This can take place in the workplace or in the public arena. Now to differentiate CoP’s from CoI’s. CoP’s get most attention in the workplace. CoI’s – there most serious work is detached from the workplace. There is a dearth of literature on this.

Success factors for CoP’s :  A successful CoP must be a physical community / A successful CoP must not have management setting the Agenda / To be successful CoP’s must have recognisable outcomes / Treat CoP discussions as conversations. Just taking the recognisable outcomes aspect it is necessary to emphasise that ‘the knowledge as it is created must be communicated’. In @ 2005 Shell and MNDA () reported similar findings in creating a Knowledge Base from CoP outcomes :  Cost :- 20% (30%). Value :- 85% (90%). Compare to standard  Knowledge Base stats : Cost :- 80% (70%). Value :- 15% (10%). These figures speak for themselves.  So we can sum up the reasons for a revival in interest for CoP’s as follows : Cost pressure on training and formal means of development in the workplace / collaboration and social media are accustoming organisations to non-structured working / the need to find ways of keeping employees engaged / technology for discussion forums is less of a challenge.

Dion concluded his talk by saying that ‘you really have to want  to do it’ to run a successful CoP. There is a benefit in commencing. There must be proper facilitation. There must be adherence to best management practice. A CoP is, in reality, a ‘Community of Commitment’. It fits in very well indeed with project management.

Graham Robertson – a NetIKX ManCom Member – then gave a brief history of NetIKX going back many, many years to when it started up at Aslib. Lissi Corfield – another NetIKX ManCom Member – spoke about our current ideas at NetIKX to take things forward as people are not coming along to meetings as frequently as they used to do. She talked about building resources in Information Management and Knowledge Management on the website and publicising and, indeed, interacting with our group on LinkedIN. Both Graham and Lissi are practitioners in Knowledge Management.

Under Lissi’s supervision we then broke up and started syndicate sessions at the close of which each syndicate reported back to the meeting. The main points are highlighted below.

Syndicate 1 : How to gain management support for CoP’s – the fears and successes.


  • Fear may be seen as presenting formal advice.
  • Encourage openness with no anonymity.
  • Resource of sharing policy together.
  • Each table is its own CoP.

Syndicate 2 : How do you become involved in existing CoP’s ? Should you bother ?

  • Senior actors are already connected.
  • Impose / grow organically.
  • Cross organisation / grows out of a need.
  • Can we learn from Quality Circles ?

Syndicate 3 : What is a good moderator ?

  • Challenging
  • Active/passive
  • Online/in person
  • CoP/CoI
  • Ground rules
  • FAQ’s/steering friendly discussion
  • Energy
  • LinkedIN

Syndicate 4 : Developing IM and KM resources for the NetIKX website

Valuable contributions were made by David Penfold, Martin Newman and Conrad Taylor.

Robert Rosset input suggestions of individuals and organisations from whom NetIKX had learned on the WIKI page of the website.  Rather like potter’s clay it needs to be worked into shape. An ounce of practice is worth a ton of theory.

Rob Rosset 22/09/15


Selling Taxonomies to organisations, Thursday July 3 2014

Blog for NetIKX  July 3rd 2014  Whatever happened to Margate?

The NetIKX meeting this month was highly popular.  I thought a session on Taxonomy might be considered dull, but I guess the hook was in the title: ‘making the business case for taxonomy’.  The session did provide great ideas for making a business case for an organisational taxonomy project, and the ideas were suitable for other contexts where direct quantifiable benefit will not be an output of the project and so immediate impact on ROI is not a simple computation.

There were two case studies presented.  The first from ‘Catalogue Queen’ Alice Laird, (ICAEW), faced the business case quandary head on.  How did they get hard headed finance to budget for their taxonomy plans?  The winning move here was to show in small scale the value of the work.  People in the business realised that the library micro-site was the best place to find things and asked why this was so.  The knowledge management team were able to demonstrate how the taxonomy could increase organisational efficiency and so helped prove the case to all website users.

This case study also provided tips for running a taxonomy project.  They used a working group from the body of the organisation, but kept the team small to ensure each person involved was clear about the relevance of the project to them and their team.  They also made the project stages clear: a consultation stage might show where there were contradictions and confusion, and so there was a following stage where the people with appropriate expertise would to step in to make firm decisions.  By setting out the stages clearly, they avoided protracted discussion and also made good use of the skills already available within their team.  In this way they fully exploited their assets! All in all, it was good to hear a crisp report about a well organised project, and we all wish them luck for their imminent implementation.

The second case study looked at using a taxonomy to help share data between different organizations in the UK Heritage sector.  In a talk called ‘Reclassify the Past’, Phil Carlisle (English Heritage) entertained us, explaining a particular problem that fuelled the need for a taxonomy project.  At one point, although the classification system worked well in most respects, some vital geographic data was not included.  As a result, a search on, for example, Margate came up with a blank, even though the data was in there.  The danger was of reputation loss – particularly with people living in Margate!  Highlighting this type of blip was another useful way to sell a structured taxonomy project.  Search, even with a good search engine is more complex than many people realise and poorly organised metadata can cause problems that ‘Google it!’ may not solve.

This case study also provided an interesting operational tip.  In order to create the best platform for sharing, this team gave away the software they were using to others in the field, as the cost was outweighed by the overall benefit of standardisation.

The session ended with a lively set of discussions.  I was with a group trying to identify more closely how a taxonomy should be classified: animal, vegetable or mineral? We found some paradoxes to play with.  For example, does a taxonomy work as a device to structure data or is a structure already in place, the basis for the taxonomy?

To conclude, it was ironic that one of the speakers commented jokingly, ‘there’s no gratitude!’  Fair comment, as basic information infrastructure projects do not usually attract riveted attention. But, at this meeting at least, where taxonomies are loved and cared for, and business case tips are welcomed, the speakers could rely on full appreciation and gratitude from a very attentive audience.

Lissi Corfield (posted by robrosset)

Graham Robertson giving feedback on his group's discussions

Graham Robertson giving feedback on his group’s discussions

IMG_3670

Steve Dale summarising his group’s discussions