Social media – what next and what can we do with it?

By Elisabeth Goodman1

NetIKX’s first seminar of 2012 was its 3rd on the theme of social media in so many years.  Previous seminars have explored whether social media should be taken seriously, and how social media could be used to achieve organisational goals and the implications for organisational IM / KM policies and strategies.

This seminar took a broad look at emerging trends and products, their likely implications, and how social media are being, or could be used.

Our first speaker was Steve Dale, “a passionate community and collaboration ecologist, creating off-line and on-line environments that foster conversations and engagement”.

Our second speaker, Geoffrey Mccaleb describes himself as a social media  / mobile consultant.

This blog reviews some of the common themes arising from their presentations, points discussed in syndicate or break-out groups, and in the concluding Q&A, and some of the author’s own reflections.

Social media have been evolving into so much more than plain communication tools

Both speakers shared statistics on Facebook, Twitter, LinkedIn, Google Plus, YouTube and other social media usage.  The conclusion: the use of social media tools is enormous and growing!   But how these tools are being used, or what they are being used for is also evolving.  Here are some examples.

1.     Facts and figures on some of the better known uses of social media

Employment

89% of companies used social media for recruiting in 2011.  One in three rejected candidates based on something they saw online.  45% of companies surveyed used Twitter to find candidates, and 80% used LinkedIn.

Politics

This is perhaps one of the most publicised uses for social media.  However, although in 2011 saw 230K tweets per day about change in Egypt the CIA were blamed for ‘missing’ Egypt protests by not monitoring Twitter.  Similarly, whilst SOPA protests were being organised online, all but one of the traditional networks in the USA failed to cover them.

Reputation management

Social media is a vital medium for managing an organisation’s reputation, and yet the average time between something going viral and an official response is 48 hours.  There are some exceptions for example Southwest Airlines who actively monitor and rapidly respond to anything posted on Twitter about them with a resultant positive impact on their reputation.  To what extent are our organisations doing this?

Publicity / PR

47% of journalists used Twitter as a source in 2011 (up from 33% in 2010).  Market-specific blogs are proving to be more popular sources of news than traditional media.

Customer support

It’s all about rethinking how companies / organisations engage with their community: social media should be a “company-wide engagement model”.

2.    A broader exploration of how social media are evolving

Sharing information on interests and hobbies

Facebook lends itself well to doing this already, and is always adding new features to take this further.  It’s new timeline tool being one potential example.  There are other tools, such as ‘Pinterest’ that take sharing of this kind of information to another level.

Curation of information from multiple sources

Scoop.it, paper.li, Storify, Flipboard are all examples of how ‘social curators’ can bring together content from several different sources that may be of interest to their audiences.  Although we did not discuss this at length, this might be a tool that Library and Information professionals could use to help their end-users with information overload?

Collaborative consumption

Some tools enable people to manage the sharing of physical resources.  Examples of this are ‘Boris’s’ bikes (the London shared bicycle scheme), sharing the use of an otherwise under-used private car, ‘airbnb’ to rent out ones house / bedrooms to visitors e.g. to the Olympics.  Might this be an alternative model for managing information resources between organisations?!

‘Managing’ big data

This is a pet subject of Steve’s, with data sets on the cloud becoming so large that they can no longer be managed with standard database management tools.  The data are usually on the cloud and include photos, traffic data, and medical data.  Visualisation and infographics tools are one way to represent and analyse these large volumes of data.

Game-ification

This is an interesting exploration of how the ‘game’ attributes of user engagement, loyalty to brands, and rewards might be transferred to a professional social network environment.  In a previous seminar we heard how The Open University Library Services were already experimenting with using virtual reality tools as a support for their services.  Game-ification may take this further?

Augmented reality

There are applications for golf that will let you know where the nearest bunker is and the direction of the wind.  Pointing your phone at the sky can give you information about the constellations. Augmented reality applications literally augment the information that you perceive and thereby help you to look at your world in a different way.

Location-based services

Tools such as Foursquare enable you to find out what’s near you, check-in, see who else is there, become ‘mayor’ of your local pub(!) etc.  ‘Easypark’ – is a Danish company which enables you to pay your parking fee and have a count-down to let you know how much time you have left to park.  There is potential for these tools to be so much more than a status update, because they tell others that you like something / somewhere.

3.     Some final reflections on technology trends and implications

Mobile platforms

Technology cycles are usually 10 years long, and we are now 2 years into mobile technology.  Anticipation is that mobile technology will overtake desktop technology within 5 years. And some surprising statistics:

  • More people own mobile phones than toothbrushes!
  • 371K children are born every day.  377K iPhones are sold every day!

Apps

2005 – 2010 was about design for the PC with consideration for mobile platforms; 2011 – 2012 (and beyond?) will be about design for mobile platforms with consideration for PCs.

The social graph

This represents all the people that we interact with online: who we know and who we respect online.  37% of US social media users trust what their friends say about a brand or product on social media.  60% will buy something on the basis of what their connections recommend.  Facebook (with shares / likes) and Twitter (with retweets) work on this basis, Google Plus is Google’s attempt at recreating the same thing.

What do people want?

To access their data everywhere – aka what is your cloud strategy?
To see things relevant to us – aka what is your social graph strategy?
To have the same experience regardless of our device – aka what is our mobile platform strategy?

4.    Implications of what we heard

We explored several themes in our break out discussions and in the Q&A that followed.

What is the role of information intermediaries in the context of social media?

Are we being pushed out of our roles by these tools – or does our ‘cyberlibrarian’ or ‘curator’ role become even more important?

What is the associated information risk?

With a lot of personal information going on the internet / in the cloud, is there more scope for criminal activity and identify theft?  There was concern that young people don’t appreciate the privacy issues.  That they are not receiving the education they need about this.  That tools such as Foursquare are invitations to burglars whilst we are not at home.

How to decide what tools to use and when?

The key is being clear about who we are trying to target and what tool(s) they would use.  We discussed the difficulty of changing mindsets within organisations where there are ingrained fears about the use of social media… and how using related case studies, collecting examples of what people have been saying about the organisation, or event taking unilateral action and showing the results (!) may be the way to do this.

Participants mentioned:

  • The BBC’s ‘YourPaintings’ joint initiative with The Public Catalogue Foundation and museums and public institutions throughout the UK encourages people to ‘tag’ their favourite oil paintings.  It currently has 104,000 pictures in the collection.
  • Phil Bradley’s presentation and notes: “25 barriers to using web 2.0 technologies and how to overcome them” might also provide good insights.

How / why could people use social media tools within their organisations

Chatter, Yammer are Twitter like tools being used within organisations, and in some cases have a dramatic effect on lowering the use of e-mail.  Chatter and Yammer threads are saved and searchable: and work well for organisations where people are working in different time zones.  We didn’t discuss this here, but such tools could be excellent for idea generation and problem solving, or ‘crowd-sourcing’ within an organisation.

Note

1. Elisabeth Goodman is Programme Events Manager for NetIKX.  She also runs her own business, RiverRhee Consulting.

What next for the Web and information services? Linked data and semantic search

By Nicola Franklin

Where is the web going?  That was the question the speakers at the 2nd November 2011 NetIKX seminar were aiming to answer.  This join event, run with the Information for Energy Group (IFEG) and hosted at The Energy Institute, addressed the issue of linked data and the semantic web.

Whereas Web 1.0 might be thought of as ‘brochure ware’, one-way communication, and Web 2.0 has come to mean interactive, two-way communication online, the future seems to be for information and knowledge management itself to move onto the web.

The two speakers at this session described how this phenomenon is coming about, from two perspectives – Richard Wallis of Talis from the point of view of a producer or publisher of linked data onto the web, and Dr Victoria Uren of Aston University from the perspective of a researcher searching the semantic web.

What is linked data?  Richard gave an excellent introduction to the topic, leading us through a logical path to understanding how information from different data sets can be shared, merged and used online.  When the web originated, it was about publishing text documents with links to other text documents, using html.  Linked data is about linking ‘things’ to other ‘things’, by giving them a label or identifier (a URI).  Things also have attributes, like a name, size, location, etc.

The example Richard used was a spacecraft. 

A spacecraft is a ‘thing’ and can be given a label, such as:

1969-059A.

To make sure this is a unique label, some more information might be added, for example:

spacecraft/1969-059A.

To make sure people know it is your spacecraft you might add some extra information:

nasa.dataincubator.org/spacecraft/1969-059A

To store (publish) some information about this object on the internet you just at http://

http://nasa.dataincubator.org/spacecraft/1969-059A

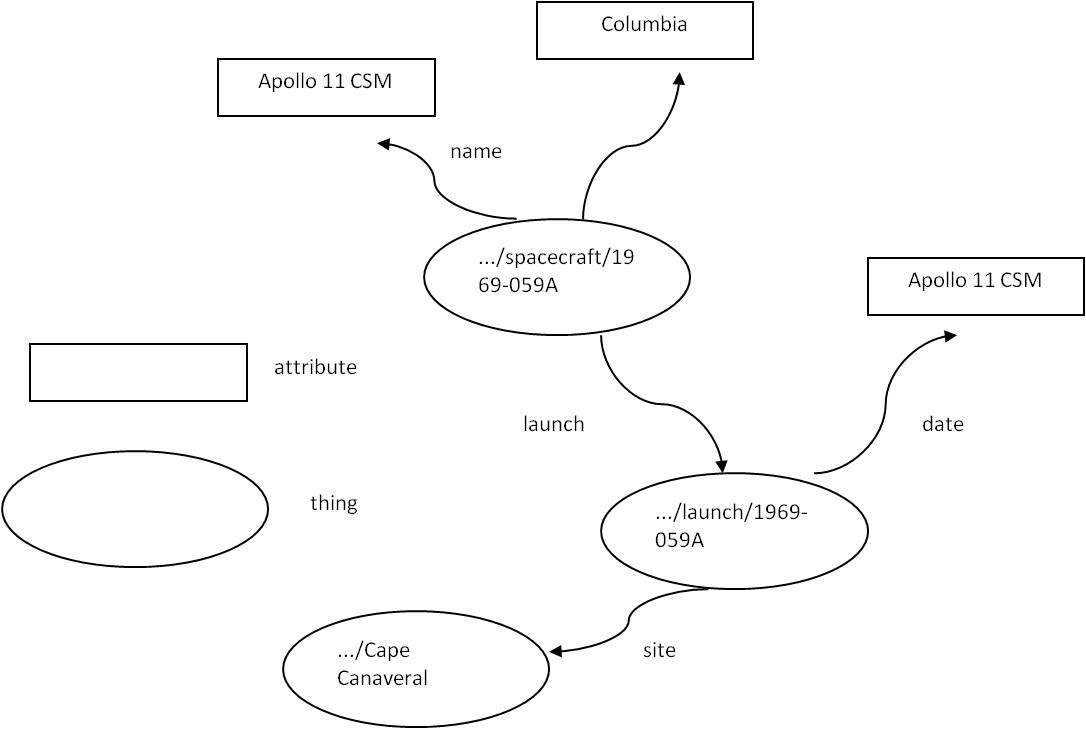
When people start thinking about things, their attributes and how they link up together, they tend to think visually:


To transfer this into machine readable ‘computer speak’ the ovals are replaced by brackets:

<…/spacecraft/1969-059A>                    =  a thing

name Apollo 11 CSM                                       = an attribute and the value for that attribute

This language is called Resource Description Framework, or RDF for short.

Once common objects, or ‘things’, which are being  talked about by different people, in different locations, are identified by the same RDF label, then attributes or data about those things can be merged from those different sources – the data can be linked.

This can be very powerful.  For example, location data drawn from the Ordnance Survey can be linked with local authority data or central government data or NHS data.  This could answer questions like “how much was spent by this organisation in that area on this service, when this party was in power?”.

An example of linked data in action can be found on the BBC nature website.  This links together video archives from the BBC, information from Wikipedia, and information from other species or habitat-specific websites from various other organisations, displaying them all on one page.

Linked data can be used within an organisation, to publish data behind a firewall using intranet tools, which links together information from different business units, or held in different (perhaps incompatible) IT systems.  It can also be used to publish data externally to the internet, where other people and organisations can link it to their own data – either by using the same identifiers for ’things’ in common, or by mapping between their identifier and another one used for the same ‘thing’.

Some common standards are emerging, where ontologies or naming schemas are being published and adopted to ensure that different organisations use the same identifying labels to refer to the same ‘things’.  One example can be found at Schema.org, which is the standard being jointly adopted by Google, Bing and Yahoo.

How about semantic search?   Victoria’s talk began from the opposite end of the spectrum – given that linked data exists on the web, how do you search for it?

Traditional online searching is based around keyword search, which uses methods such as counting words, page ranking using links, controlled form searching (eg; OPAC) or metadata.  These methods were developed for searching text.  To search structured data needs a different approach.

Victoria listed a range of query languages that have been developed but said that SPARQL, which was based upon SQL, was the most widely utilised.  As it isn’t reasonable to expect users to familiarise themselves with a query language like this in order to carry out a search, a more friendly user interface is needed.

Again a range of methods have been developed:

  • Keywords
  • Forms
  • Graph based
  • Question answering
  • Tabular browsing

Victoria described the pros and cons of each method:

Keyword searching is easy to use but is restricted to simple searches for ‘a thing’.  Forms are a familiar interface, and allow more complex searches than single keywords, but forms need to be predefined and are therefore restrictive.  Graph based searches give a visual representation of the data, but this is hard to do for anything more than one ontology (ie, data from one source).  Natural language question answering is easy for the user, and good for heterogeneous data sets, but requires some heavy duty computing power to avoid being very slow.  Tabular browsing, where you start with one keyword and are presented with a whole range of linked words to chose from to narrow the search, can be clumsy.

Victoria felt that semantic search is very good for corporate data management, where information is typically focused around one topic area and it is very useful to be able to bridge between different data silos.  She gave examples of Drupal7, Virtuoso and Talis as systems that can be used for this.

Following a coffee break Syndicate Groups were set up to discuss several questions:

  • What is the value to a business of using linked data and semantic search?
  • Who would use the stuff from our organisation?
  • What are our needs for corporate data management – what tools are needed?

I took part in one of the two tables discussing the first question.  We felt that linking silos of information could help more people to find the right information, more quickly, and also to discover information they previously didn’t know existed (and therefore wouldn’t search for).  This could lead to finding the people behind the information and strengthening relationships.  It could also increase efficiency, raise cross-fertilisation and improve innovation.

During the group feedback session and discussion that followed, the issue of the risks of open and linked data was brought up.  Could increased ease of access to some data, and the linking together of many pieces of data from different sources into one location, be misued?  One example given was of insurance companies, potentially refusing to insure someone for a life or healthcare policy who they’d discovered had an unhealthy lifestyle.  Another example could be terrorists making use of combined information from Ordnance Survey data + google maps + other data sets to plan atrocities.

Linked data tools and open data publishing seems to have many potential benefits and also some risks; as with any rapid change the regulation and safeguards against the risks will probably lag behind what is taking place in practice.

Developing our capability – a seminar with Chris Collison

By Nicola Franklin

Yesterday afternoon saw me crossing London to attend my second NetIKX seminar, which I was looking forward to after a very interesting first foray a few months ago on the topic of social media use in organisations.  On this occasion we were to learn about the use of River Diagrams in facilitating knowledge sharing, from ChrisCollison, originally from BP and now working independently via Knowledgeable Ltd.

Chris introduced the subject by saying that River Diagrams are a way to visualise the results from a maturity model or self-assessment tool, looking through the lens of knowledge-sharing.  According to the OGC (* please see note below – Ed) a maturity model

“provides a systematic framework for carrying out benchmarking and performance improvement.”

Chris described knowledge management as a learning marketplace, with supply (of people with knowledge) and demand (of people needing to learn).  For any marketplace to work effectively, however, it needs a shared currency (so there is benefit to both sides in making the trade) and a common language (so that what is being traded is clearly understood by both parties).

The process of creating River Diagrams, and analysing them using Stairs Diagram (more on these later!) facilitates the creation of this common language as well as highlighting clearly which parties have knowledge and which parties need that knowledge.

OK, so what are River Diagrams and how do you go about creating one?

Firstly you need a group of participants.  These could be representatives from different departments within an organisation, people from several business units within a company,  or different stakeholders concerned with the same social, political or business issue.  Then you need to decide upon which topic or area of performance you want to benchmark or measure.

Chris described a River Diagram exercise from his time at BP, where they wanted to compare their 99 business units to agree which operational areas they all had in common (eg health & safety, corrosion management, water handling, etc), and benchmark performance of all the business units in each area.

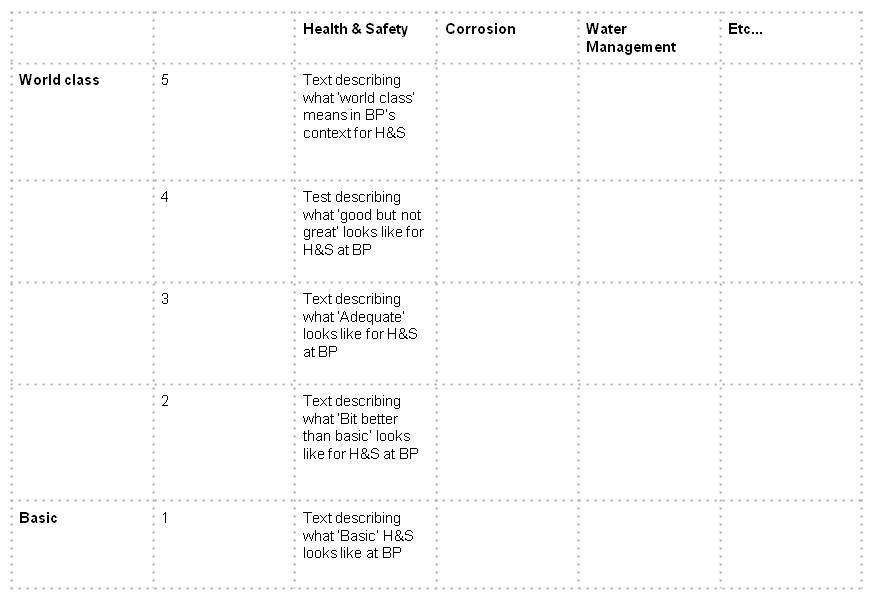
First of all the participants needed to agree the operational areas and  ‘what success looks like’ for each one.  This is part of creating that common language.  To make the model work, they needed to agree five levels of performance for each operational area, from ‘world class’ (5) down to ‘basic’ (1).

This led to the creation of a self-assessment tool, looking something like this:

River Diagram Table

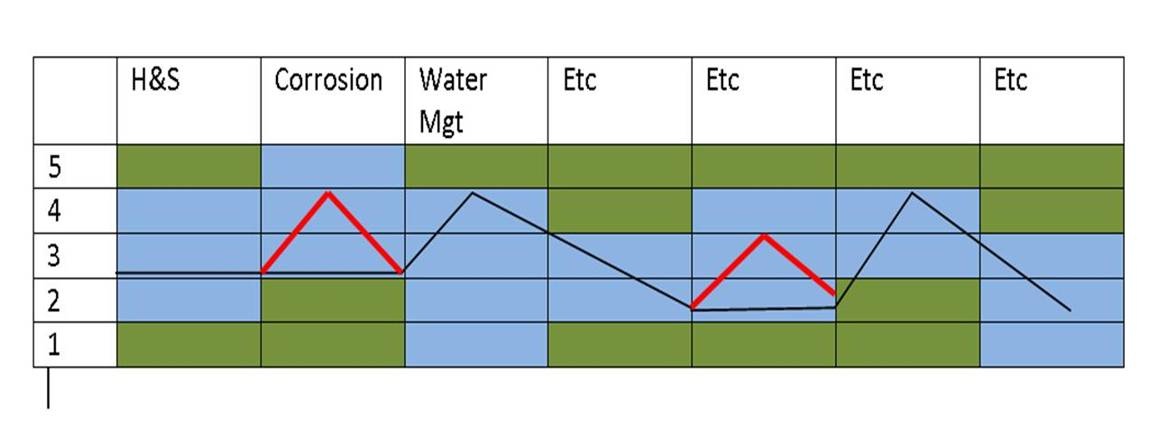
To fill this out, the participants from each business unit have a dialogue about where their unit falls, for each of the areas, until they agree a score for each one.  This results in a chart something like this, for this one business unit (let’s call them Group A):

River Diagram 1

Adding in the scores for the other business units increases the ‘width of the river’ or number of blue shaded cells:

River Diagram 2

With the remaining cells coloured green, the river analogy suddenly becomes clearer!

The ‘river banks’ represent those areas where none of the business units had a score.  Each group also records which two of the topic areas they would like to improve, and by how much.  Adding in this information allows the facilitators and participants to see where groups have knowledge to share (since they scored highly in that area) and where there are groups are keen to learn (since they logged a desire to improve their score in that area).

River Diagram 3

The black line shows the scores for Group A added to the composite diagram, and the two red lines show the two areas they chose in which they’d like to improve.

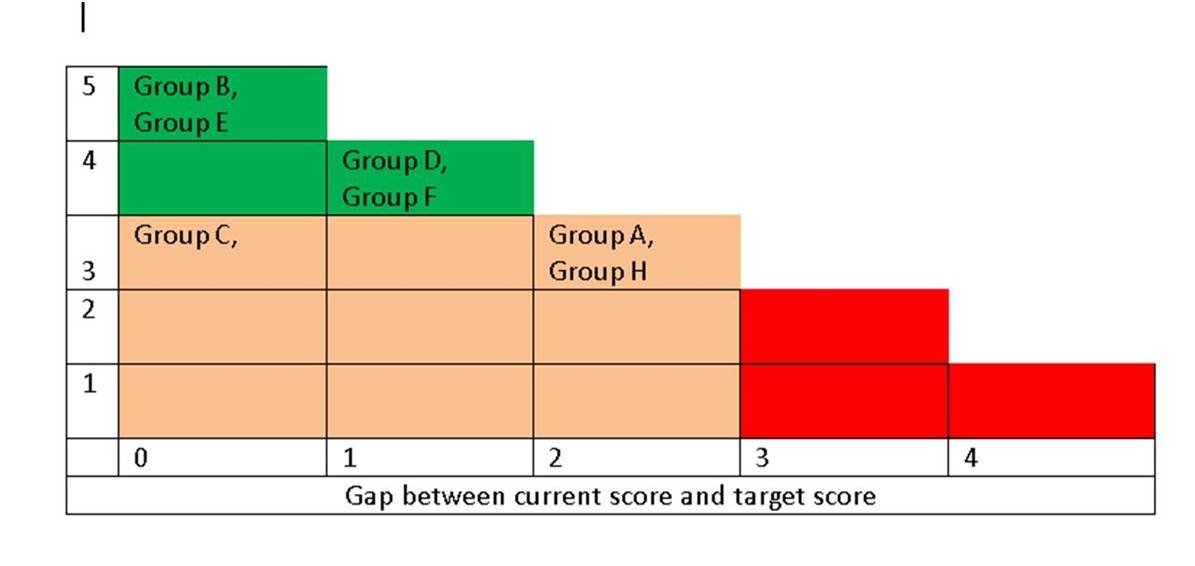
If you take one of the topic areas from the River Diagram, you can analyse the situation across all the groups in more detail for that topic by using a Stairs Diagram.  Here’s an imaginary Stairs Diagram for the ‘Corrosion’ topic area:

River Diagram 4

This shows each Group plotted according to the levels they scored (vertically) and the gap between their current level and the score they would like to reach (horizontal).  You can see that Group A could benefit from having a dialogue with Group B or E who are both at level 5 for this topic.

Chris went on to tell us about using the River Diagram technique to help the UN HIV and Aids group work with stakeholder groups across the world, to find out and benchmark the elements that make up a successful Aids management programme and to help the different groups learn from each other.

Chris emphasised that a lot of the work for this technique goes into the selection of topics and discussion to agree on the descriptions of each of the different levels, for each topic.

Once he’d explained how it all worked, it was time for us to have a go at creating our own River Diagram.  Since there wasn’t time in the afternoon session to write all the level descriptions, Chris had pre-prepared one based on a topic he hoped we were all familiar with – information and knowledge management!

He asked us to rate our own organisations for each of the topic areas he’d selected (eg, Knowledge Strategy, Using and Accessing Expertise, Exploiting Information, etc). It became clear that there would be a lot of value in getting different stakeholders in an organisation, department or other group to discuss where they felt their body scored for each area – and why.

One question that came up was, if one group’s goal was to improve in a topic, but none of the other groups had scored highly in that area, how could you improve ‘beyond the river’ (ie into an area on the ‘north bank’ that is coloured green)?  Several suggestions were made:

  • Bring in an external consultant
  • Set up peer referencing with another organisation (in your industry or from a completely different field)
  • Generate your own innovative solutions internally

Another suggestion from the floor was that it would be valuable to re-run an exercise like this in 6 months time, to get a comparison and measure whether any improvements had been made in the targeted areas.

A final thought that Chris added to the group discussion were two questions knowledge managers should ask the leaders in their organisation to ask all the time:

Of people with a problem = “who can you learn from?”

Of people with a success = “who can you share this with?”

The formal part of the afternoon concluded at about 5.00pm, followed by some equally enjoyable wine and networking.  I found this a very enjoyable and interesting session, and think this would be a valuable tool to add to any information and knowledge manager’s armoury.

Nicola Franklin

Director, The Library Career Centre Ltd

P.S. Chris also suggested these 2 links might be of interest:

http://www.communitylifecompetence.org/en/29-aids-competence

http://www.youtube.com/watch?v=Ai7LcCzOJo8&feature=fvst

*Note from the Editor (with thanks to Graham Robertson)

The OGC website will cease to exist from 1st October 2011Any new information will be published on the Cabinet office website:
http://www.cabinetoffice.gov.uk/All information currently on the OGC website will be available on the National archives website:

http://webarchive.nationalarchives.gov.uk/20100503135839/http://www.ogc.gov.uk/index.asp

Please update any bookmarks you may have, and if you have any queries or questions please contact 
==================== ++++++++++ ====================

Defragmentation – the latest meeting

The third meeting of what began with the fragmentation /death on the CILIP LinkedIn Group last August was held on Tuesday 31 May.  The first two meetings, the second of which I wrote about on 24 February, were invitation only, but this one was open to all, and attracted over 70 people.  It was hosted by the British Computer Society and opened with a welcome from BCS’s President, Jim Norton.  Then Conrad Taylor, one of the organisers, set the tone by quoting from Sue Myburgh’s PhD thesis on the future of the information professional.  (Sue is happy for people to email her for copies – .) Mark Field, who started the whole thing off, sketched in the background and Nicola Franklin, the third of the organisers, explained her involvement which came from seeing the narrow view of what the profession was about that so many of the new professionals she interviewed as a recruiter, a siloed approach which often continued through their careers.

Conrad stressed that one of the key elements of the meeting was the opportunity to talk to people from other organisations, and asked representatives from some of the many represented to briefly describe them.  There were contributions from BCS, CILIP, IRM, BIALL, KIDMM, ISKO UK, SLA Europe – and NetIKX, of course.  In my two minutes I explained that NetIKX covers a very wide spread of information professionals – and others who wouldn’t describe themselves that way but are still interested in many of the topics we discuss.  We then spent time in our small groups to discuss the six questions that had been posed.  (You can find these and much else in the wiki that has been set up to support all this.) Throughout there was a constant stream of Tweets on the topic, both from those at the meeting and from others who were following the #infodefrag hash tag.  One striking one was from someone who pointed out that they belonged to no organisations but used social media to keep in touch – which was how they had found out about the meeting and come along!

I’m not sure than we really managed to answer any of the questions but it did produce some very interesting and lively discussions – and more questions.  There was also an intriguing argument that diversity is fragmentation turned upside down and we should celebrate diversity.  We then went on to consider how those present and the organisations they represent can do to move things on to ensure the information professions can survive as a community.  There is considerable support for the idea of an information charter and manifesto.  We need to articulate the value of what we do, and for this we need stories – and there was a great one about the IMF.  We also need to describe a core of competencies, and to link together the common and transferable standards that organisations like BCS and CILIP have already defined.  Mark Field suggested the production of an annual report, “The state of the information profession this year” to set out our achievements and raise our profile.

So what next?  The liaison group will continue, developing the wiki as a resource – so do check it out, and hope to involve other people to work on the action points that Nicola identified in a series of tweets

  • create a repository of stories that show value of information professionals
  • work on a core competency statement, and look at common professional  standards in the associations
  • get information groups to agree to work more together, eg joint meetings, joint training
  • produce annual report on ‘ the state of information profession this year’ with logos of all info groups in the back

NetITX is committed to working with this project, because we feel it is so much in keeping with what NetIKX is about, bringing everyone who works in information together whatever their job title or starting point whenever there are topics of general interest to learn about and skills and experience to share.  We would love to hear from you – your comments of the six questions, your thoughts about what we should be doing – email me at .

For more on this, see the wiki, James Mullan’s detailed report on his blog,  Nicola Franklin’s discussion of key points and Val Skelton’s summary

From fragmentation / death to cohesion / life

In August last year Mark Field started a discussion on the CILIP LinkedIn Group which he called The Fragmentation Death of the Information Professions.  It attracted some 200 comments, and runs to around 29,000 words.   (You can find the whole thing at http://tinyurl.com/35bglbs, but you have to be a member of the group to access it – it’s very easy to join.)

One of the reasons the discussion was so lively was that it was clear that it was not simply a talking shop.  Mark and others were planning to do something about it, to try to bring about “a comprehensive, hospitable and rigorous over-arching professional framework for information scientists, librarians, records managers, archivists, and their emerging new sibling professions in information architecture”. NetIKX encouraged its LinkedIn Group members to participate in the discussion – and quite a few did.  The first meeting was on 14 December and CILIP, BIALL, IRMS, SLA and BCS were among those represented.  It was agreed that the group should seek to involve other organisations and the NetIKX Management Committee made it clear we would be interested in taking part.  Our membership, though not large, covers a wide range of disciplines and organisational types so the discussions are very relevant to us.

The second meeting was held on Tuesday 22 February and I went along.  We had some very constructive discussions, clarifying just who we were seeking to bring together, and who we wanted to influence – a long list including government, senior management, businesses of every size, professional bodies, politicians, the media (and through them the public), employers, and all those who manage information as part of their role (to encourage best practice).

We agreed that we need to produce a manifesto and an information charter, and that in the mean time the group will need to establish a web presence and distribution channels. I will continue to take part, but if anyone else is particularly interested, please contact me. Watch this space.

Suzanne Burge
NetIKX Chair

Using social media to achieve organisational goals – the next steps

Blog by Elisabeth Goodman

A shift from skepticism about, to evangelism for Social Media?

On 19th January, NetIKX hosted what proved to be a very successful seminar on this theme, with speakers Dr Hazel Hall1 and Nicky Whitsed2.   It was a follow-on seminar to one hosted the previous year, where we had introduced our members to a range of social media tools, and questioned if and how NetIKX might use them and also guide people in their use3.

Although our January 2010 seminar was also very popular, there was still some skepticism about the value of social media tools, and how organisations might use them.  This time, as Hazel commented to me in an aside at the end of the meeting, the tone was perhaps more one of how organisations might be persuaded to adopt the wider use of social media.

Social Media can be used by Library and Information Departments for a diverse range of purposes

Our speakers described the wide range of uses that social media tools can be put to, and their ability, beyond that of the previous tools available to us, to connect people as well as data and information.  We and our customers, can use social media tools for:

  • Collaborating on projects and for learning through wikis and ‘tweet-ups’
  • For staff development, teaching and training e.g. through ‘amplified events’ where someone present at an event will be sharing the content through Twitter with those who cannot attend.  Or by posting a recording of the event for others to access afterwards.  The Open University use Illuminate to run and record such events.
  • Providing virtual reference sources
  • Seeking feedback or peer review on planned presentations (which Hazel did for this presentation)
  • For gaining a better understanding of customer needs leading to new service developments

As Nicky pointed out, it’s important to understand the tools that our customers are using, and to be able to deliver services through those.  In fact her department has a ‘digilab’ where they have all the latest technology and social media tools, enabling their staff to become familiar with their use, and experiment with new ways of delivering their services.

The adoption of Social Media will be evolutionary, with some people leading the way

In the syndicate discussion groups that followed the presentations, delegates discussed the already visible evolutionary pathway in the adoption of social media by organisations.

Human Resources departments are using tools such as LinkedIn to learn about potential recruits.

Sales and Marketing teams are using Twitter and monitoring the web to find out and in some cases respond to what their customers are saying, monitor the competition and also influence the perception of their organisation.

Some companies are using tools such as Yammer internally to try out the use of such tools, or even to support the ‘crowd-sourcing’ of ideas in project management or general problem resolution4.

There needs to be a fine balance between policies and trust

It’s certain that organisations need some form of policy for the use of social media to address such issues as security and ethical behaviour.  Nicky shared details of sites such as http:/socialmediagovernance.com that can help us with that.  However, policies need to allow sufficient scope so as not to discourage the use of social media.

Library and Information professionals could influence the policies within organisations, and even encourage the adoption of values or competencies within performance review frameworks that promote knowledge sharing through social media tools.

As we discussed in one of the syndicate groups, people are used to assessing and building trust through face-to-face interactions.  Social media users are now finding proxies for building that trust, for example by relying on the judgment of those whom they know already, seeing which postings are re-tweeted by others, reviewing the posting history of new people that they ‘meet’ online.

Increased adoption of social media by organisations will require a cultural change

Again, as put by one of the syndicate groups, we are operating in a ‘perpetual beta’ environment.  This is a shift for organisations that are used to making decisions on well-established software with a firm support infrastructure.

As Hazel put it, we also have a ‘youngster elders’ scenario, where people who are perhaps more used to leading and being the authority on subjects, need to be open to seeking guidance from the more knowledgeable younger generation (as some of us may already be doing at home!).

Hazel and Nicky described how Library and Information professionals can play a role in guiding and supporting the evolutionary adoption of social media tools by:

  • Demonstrating how the tools can be used
  • Experimenting and developing our own capabilities, as well as giving our users the opportunity to experiment
  • Providing training e.g. in digital literacy

Concluding thoughts

The use of social media tools in the organisation should be part of Library and Information Management strategy but they tend to be owned by Security.  We need to help organisations to switch from an emphasis on the risk of using social media, to the risk of not using these tools.

Notes

  1. Dr Hazel Hall is Director of the Centre for Social Informatics in the School of Computing at Edinburgh Napier University. She is also leads the implementation of the UK Library and Information Science Research Coalition. Hazel was named IWR Information Professional of the Year in December 2009.
  2. Nicky Whitsed is Director of Library Services at the Open University.  She is an experienced strategic and change manager having led successful projects in the commercial, medical and academic fields. Nicky is trained in project management and facilitation and also has experience as a trainer. She has served on a number of CILIP and JISC committees and on a number of editorial boards.
  3. Elisabeth Goodman and Suzanne Burge presented on ‘Social networking tools – should they be taken seriously’ in January 2010.  See Elisabeth’s presentation: “Using LinkedIn, blogs and Twitter for networking and communities of interest”
  4. See related blog by Matthew Loxton on crowd-sourcing
  5. Whilst writing this blog, several of the participants at the seminar also shared their accounts of the meeting.See for example the following:
  6. Elisabeth Goodman is the Programme Events Manager for NetIKX, and is also the Owner and Principal Consultant at RiverRhee Consulting, providing 1:1 guidance, training / workshops and support for enhancing team effectiveness through process improvement, knowledge and change management. She also provides 1:1 tutorials, seminars and workshops on the use of LinkedIn and other social media. Read Elisabeth Goodman’s blog for more discussions on topics covered by this blog.